Ballybough
Dublin 3 / 93 properties
Wedged between Croke Park and the Royal Canal, Ballybough's red-brick terraces date from its development as a working-class quarter in the nineteenth century. The area's industrial past — pottery, glass, distilling, brewing — has given way to residential living, though the strong community identity endures. First settled by three MacDonnell brothers fleeing the Ulster Plantations in 1605, it carries more layers of Dublin history than its modest streetscape might suggest.
Ballybough contains homes with addresses ending in both Dublin 1 and Dublin 3 .
Investment Growth Rate
Repeat-sale properties in Ballybough have changed by a median + 12.4% per year over 12.2 years (2013 to 2026) , based on 8 properties with at least two recorded sales. How we calculate this .
Price Trend
Based on 95 recorded sales across all years
Property Map
Nearby Luas Stops
Can you afford to buy in Ballybough?
The median property here is €209,000. Check if it's within reach with our affordability calculator.
Major Streets and Housing Developments
Richmond Road
€280K · 17 propertiesBallybough Road
€200K · 13 propertiesCharleville Avenue
€275K · 10 propertiesOther streets (19)
Kings Avenue
€121K · 8 propertiesRichmond Hall
€190K · 8 propertiesClonmore Road
€305K · 7 propertiesSummerhill Parade
€115K · 6 propertiesClonmore Terrace
€218K · 4 propertiesCharlemont Parade
€158K · 3 propertiesClonliffe Avenue
€302K · 2 propertiesFitzroy Avenue
€324K · 2 propertiesFoster Place North
€192K · 2 propertiesTolka Road
€110K · 2 propertiesAustin S Cottages
€251K · 1 propertyBallybough Avenue
1 propertyCrawford Terrace
€60K · 1 propertyEnaville Avenue
€262K · 1 propertyRth Strand Road
€49K · 1 propertySackville Gardens
€265K · 1 propertySaint James S Avenue
€348K · 1 propertySpring Garden Street
€130K · 1 propertyBelvedere Avenue
€150K · 1 propertyCompare with Nearby Areas
See how Ballybough stacks up against other areas in Dublin 3.
Other Areas in Dublin 3
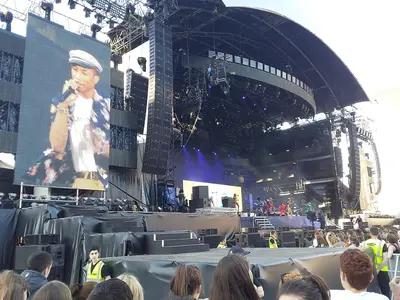
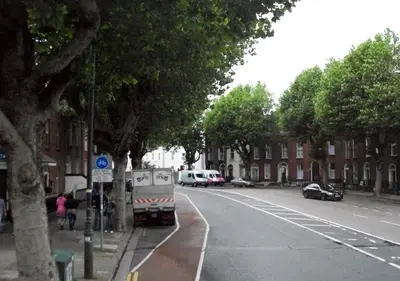
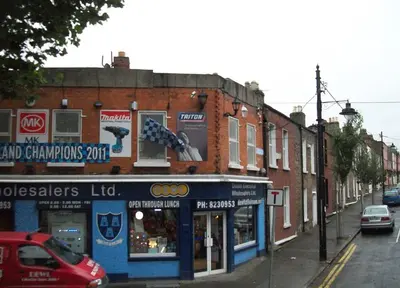
Photos of Ballybough


Related Guides
Raheny vs Clontarf: Dublin 5 Property Price Comparison 2026
A data-driven comparison of Raheny and Clontarf property prices, amenities, schools, transport, and BER ratings. Everything you need to choose between Dublin 5’s two most popular neighbourhoods.
How BER Ratings Affect Dublin Property Prices — A Data-Driven Analysis
District-by-district breakdown of BER rating distributions across Dublin, how energy efficiency correlates with property values, and what the green premium means for buyers and sellers in 2026.
Dublin Price Per Square Metre by Area (2026 Data)
We combined PPR sale prices with BER floor area data to calculate €/m² for every Dublin district. From €3,744 to €9,473 per square metre.
Related Tools
Affordability Calculator
What you can afford under Central Bank of Ireland LTI and LTV rules
Mortgage Calculator
Monthly repayments and full amortisation schedule
Rent vs Buy
Break-even timeline and net worth projection
Home Buying Schemes
HTB, First Home Scheme, Local Authority Affordable
Compare Districts
Side-by-side comparison of Dublin postal districts
Compare Areas
Side-by-side comparison of Dublin neighbourhoods
Frequently Asked Questions
What is the median house price in Ballybough?
The median property price in Ballybough, Dublin 3 is €209,000, based on 93 recorded sales.
How many properties have sold in Ballybough?
93 properties have been recorded as sold in Ballybough, Dublin 3 in the last 16 years.
What is the most expensive street in Ballybough?
The most expensive street in Ballybough by median price is Clonmore Road at €305,000.
How does Ballybough compare to Dublin 3?
The median price in Ballybough (€209,000) is 48% below the Dublin 3 median of €405,000.
What is the investment growth rate in Ballybough?
Based on 8 repeat-sale properties in Ballybough, values have changed by a median +12.4% per year over 12.2 years (2013 to 2026).
How have prices changed in Ballybough over time?
The median sale price in Ballybough has risen 148% from €145K in 2010 to €360K in 2026, based on 95 recorded sales. In the last 5 years, it has risen 17%.