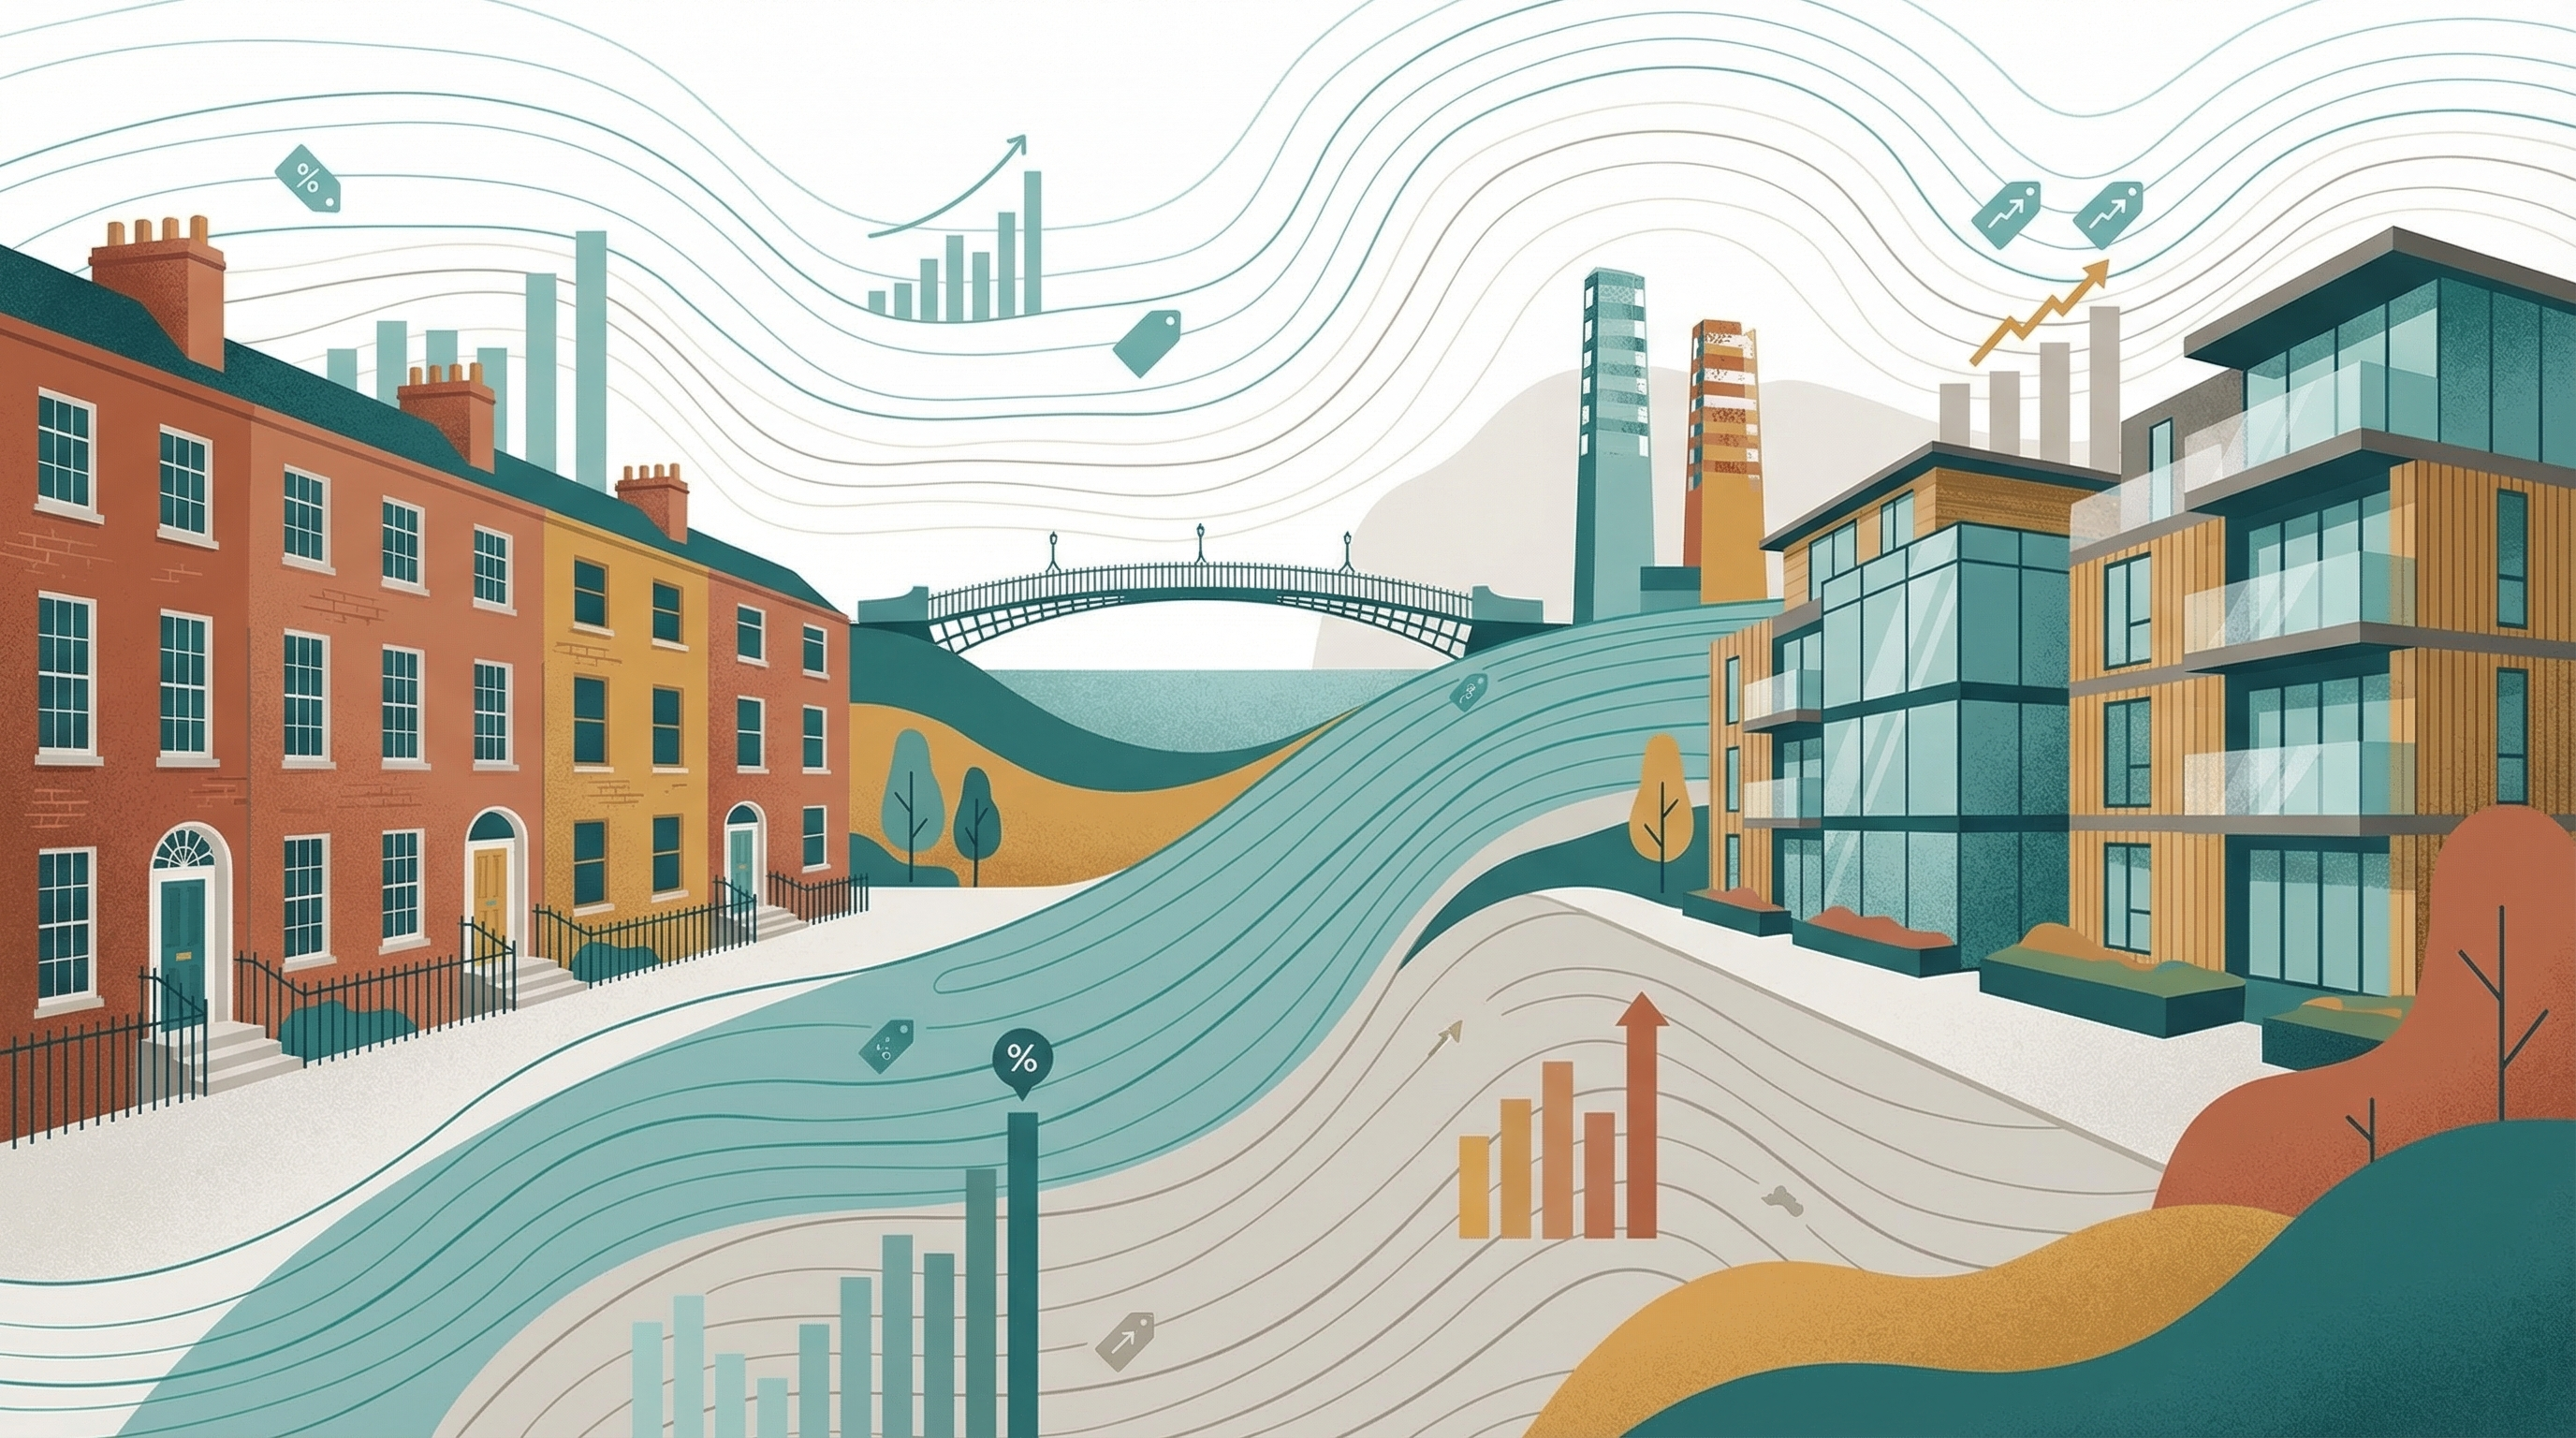
Dublin House Prices by Area 2026: The Complete Breakdown
Comprehensive data-driven analysis of Dublin property prices across all 25 postal districts and 146 neighbourhoods, based on 200,351 Property Price Register transactions.
Dublin’s property market in 2026 is a city of contrasts. You can spend close to a million in Dalkey or pick up a home in Tallaght for under €190,000 — and both are within the same county. The gap between Dublin’s most expensive and most affordable areas has never been wider.
We analysed over 200,000 property transactions from the Property Price Register to build the most comprehensive, data-driven breakdown of Dublin house prices by area. No estate agent spin. No cherry-picked stats. Just what the data actually shows.
The Big Picture: Dublin Property Prices in 2026
The citywide average median price across all 25 Dublin postal districts sits at €536,298 in 2026 — up from €504,000 in 2025 and nearly 2.5 times the post-crash low of €221,337 in 2012.
Here’s how prices have moved over the past 16 years:
| Year | Average Median Price | Year-on-Year Change |
|---|---|---|
| 2010 | €281,046 | — |
| 2011 | €244,483 | -13.0% |
| 2012 | €221,337 | -9.5% |
| 2013 | €237,236 | +7.2% |
| 2014 | €273,236 | +15.2% |
| 2015 | €291,001 | +6.5% |
| 2016 | €310,410 | +6.7% |
| 2017 | €346,961 | +11.8% |
| 2018 | €368,450 | +6.2% |
| 2019 | €372,366 | +1.1% |
| 2020 | €375,916 | +1.0% |
| 2021 | €410,230 | +9.1% |
| 2022 | €440,277 | +7.3% |
| 2023 | €436,168 | -0.9% |
| 2024 | €473,955 | +8.7% |
| 2025 | €503,622 | +6.3% |
| 2026 | €536,298 | +6.5% |
The pattern is clear: a painful crash from 2010-2012, a strong recovery from 2013-2018, a brief COVID-era plateau in 2019-2020, then sustained growth that’s showed no sign of slowing. Even the 2023 dip was barely a blip.
Dublin House Prices by District: Full Ranking
Here’s every Dublin postal district ranked from most to least expensive, with median price, annual price growth, and the number of property transactions in our dataset.
Premium Districts (€490,000+)
| District | Median Price | Annual Growth | Properties |
|---|---|---|---|
| Dublin 6 | €595,000 | 6.0% | 6,727 |
| Dublin 4 | €550,000 | 4.9% | 8,927 |
| Dún Laoghaire–Rathdown | €535,000 | 6.0% | 18,521 |
| Dublin 6W | €520,000 | 5.8% | 4,125 |
| Dublin 14 | €512,000 | 6.0% | 7,958 |
| Dublin 18 | €490,000 | 5.3% | 10,239 |
| Dublin 16 | €485,000 | 5.3% | 5,500 |
These are Dublin’s established wealthy areas — Ranelagh, Ballsbridge, Dalkey, Rathgar, Dundrum, Foxrock, and their surrounding neighbourhoods. Dún Laoghaire–Rathdown alone accounts for over 18,500 transactions, making it the most active premium market in the county.
What’s notable: even at these price points, annual growth rates of 5-6% persist. Dublin’s premium areas aren’t plateauing — they’re still climbing.
Mid-Range Districts (€300,000–€490,000)
| District | Median Price | Annual Growth | Properties |
|---|---|---|---|
| Dublin 3 | €403,881 | 6.5% | 6,338 |
| Dublin 2 | €395,000 | 4.1% | 2,695 |
| Dublin 5 | €385,000 | 6.8% | 5,885 |
| Dublin 13 | €370,000 | 7.0% | 6,142 |
| Dublin 9 | €355,500 | 6.7% | 8,576 |
| Fingal | €330,396 | 7.3% | 29,110 |
| Dublin 7 | €330,000 | 7.5% | 7,559 |
| Dublin 15 | €325,000 | 6.4% | 12,954 |
| Dublin 12 | €324,000 | 8.4% | 7,303 |
| South Dublin | €315,000 | 7.4% | 10,378 |
| Dublin 8 | €305,000 | 7.4% | 8,102 |
This is where most Dublin buyers actually end up. The mid-range is where you’ll find the strongest growth rates in the city — Dublin 12 (Crumlin, Drimnagh, Walkinstown) at 8.4% annual growth, Dublin 7 (Phibsborough, Stoneybatter) at 7.5%, and South Dublin at 7.4%.
Fingal is the volume champion with over 29,000 transactions — this huge administrative area covers everything from Swords to Malahide to Balbriggan. Its 7.3% growth rate on a relatively low base makes it one of Dublin’s most dynamic markets.
Dublin 3 (Clontarf, East Wall, North Strand) continues to outperform at €403,881 — edging closer to premium territory with a 6.5% annual clip.
Affordable Districts (Under €300,000)
| District | Median Price | Annual Growth | Properties |
|---|---|---|---|
| Dublin 20 | €295,000 | 6.5% | 1,731 |
| Dublin 24 | €290,000 | 7.0% | 11,124 |
| Dublin 22 | €281,500 | 7.2% | 5,936 |
| Dublin 1 | €275,000 | 6.3% | 4,076 |
| Dublin 17 | €255,500 | 7.5% | 1,410 |
| Dublin 11 | €246,000 | 8.4% | 7,111 |
| Dublin 10 | €226,000 | 9.9% | 1,924 |
Here’s the pattern that jumps out: the cheaper the area, the faster it’s growing. Dublin 10 (Ballyfermot, Cherry Orchard) leads the entire city at 9.9% annual growth. Dublin 11 (Finglas, Glasnevin North) matches Dublin 12 at 8.4%. Dublin 17 (Coolock, Priorswood) is at 7.5%.
This convergence effect means Dublin’s price gap between expensive and affordable areas is slowly narrowing — though at current rates, “slowly” is the key word. It would take decades of this differential to achieve any meaningful equalisation.
The Most Expensive Areas in Dublin (Neighbourhood Level)
Drilling below district level into individual neighbourhoods reveals where Dublin’s real premium addresses are:
| Area | District | Median Price | Annual Growth | Properties |
|---|---|---|---|---|
| Dalkey Commons | Dún Laoghaire–Rathdown | €986,000 | 5.4% | 226 |
| Seapoint/Templehill | Dún Laoghaire–Rathdown | €969,162 | 6.3% | 138 |
| Woodland | Dún Laoghaire–Rathdown | €870,000 | 6.0% | 84 |
| Priesthouse | Dún Laoghaire–Rathdown | €867,500 | 8.0% | 57 |
| Bullock | Dún Laoghaire–Rathdown | €840,000 | 5.9% | 577 |
| Mount Merrion | Dún Laoghaire–Rathdown | €815,000 | 5.4% | 402 |
| Foxrock | Dún Laoghaire–Rathdown | €814,977 | 21.9% | 107 |
| Newpark | Dún Laoghaire–Rathdown | €800,000 | 16.4% | 98 |
Dún Laoghaire–Rathdown dominates the top of the table entirely. Not a single neighbourhood outside this administrative area breaks into the top 10 most expensive. Dalkey Commons approaches the million-euro median — meaning half of all transactions there are above €986,000.
The Most Affordable Areas in Dublin
For buyers looking for value, the data points clearly:
| Area | District | Median Price | Annual Growth | Properties |
|---|---|---|---|---|
| Oldbawn | South Dublin | €151,000 | -11.8% | 47 |
| Tallaght | South Dublin | €182,934 | 10.4% | 257 |
| Newcastle | South Dublin | €185,250 | -34.6% | 31 |
| Clondalkin | South Dublin | €195,000 | 8.6% | 189 |
| Ballybough | Dublin 3 | €200,000 | 12.5% | 88 |
| Citywest | South Dublin | €217,500 | 15.1% | 33 |
| Stepaside | Dún Laoghaire–Rathdown | €220,000 | 10.9% | 124 |
| Fortunestown | South Dublin | €221,000 | 9.5% | 188 |
| East Wall | Dublin 3 | €235,000 | 9.1% | 352 |
| Saggart | South Dublin | €240,101 | 9.7% | 432 |
South Dublin dominates the affordable end, with Tallaght, Clondalkin, and the newer estates in Saggart/Fortunestown/Citywest offering entry points below €250,000.
The standout: Ballybough in Dublin 3, with a €200,000 median but 12.5% annual growth. It sits between the IFSC and Croke Park — an area that’s gentrifying rapidly and could look very different in five years. Similarly, East Wall (€235,000, 9.1% growth) represents a fast-changing northside neighbourhood with strong transport links.
Fastest-Growing Areas: Where Prices Are Climbing Most
These are the neighbourhoods showing the strongest price momentum, based on reliable growth data:
| Area | District | Median Price | Annual Growth |
|---|---|---|---|
| Ballybough | Dublin 3 | €200,000 | 12.5% |
| Tobermaclugg | South Dublin | €338,995 | 12.0% |
| North Strand | Dublin 3 | €287,500 | 11.0% |
| Stepaside | Dún Laoghaire–Rathdown | €220,000 | 10.9% |
| Finnstown | South Dublin | €317,181 | 10.4% |
| Rathcoole | South Dublin | €263,436 | 10.0% |
| Saggart | South Dublin | €240,101 | 9.7% |
| Coolock | Dublin 5 | €362,500 | 9.6% |
| Fortunestown | South Dublin | €221,000 | 9.5% |
 Photo: Metro Centric, CC BY 2.0
The fastest growers fall into two categories:
-
Gentrifying inner-city areas (Ballybough, North Strand) — historically working-class neighbourhoods benefiting from proximity to the city centre, Luas/DART access, and spillover demand from expensive neighbours.
-
Suburban new-build zones (Saggart, Finnstown, Fortunestown, Tobermaclugg) — areas with significant new housing development, attracting first-time buyers priced out of more established suburbs.
What This Means for Buyers
First-Time Buyers
The data suggests the best value-for-money is in South Dublin’s newer suburbs (Saggart, Fortunestown, Rathcoole) and Dublin’s gentrifying northside pockets (Ballybough, East Wall, North Strand). Entry points under €250,000 with growth rates above 9% make these areas worth serious consideration.
Investors
The convergence effect — cheaper areas growing faster — suggests a focus on Dublin 10, 11, and 12 for long-term capital appreciation. These districts combine lower entry costs with the highest growth rates in the city.
Upsizers
Dublin’s mid-range (€330K-€400K) offers the widest selection: Dublin 3, 5, 9, and 13 all provide established neighbourhoods with good schools, transport, and amenities at prices significantly below the south Dublin premium.
How We Calculated This
All data comes from the Property Price Register, Ireland’s official record of property transactions. Dublish processes every transaction to calculate median prices, growth rates, and area-level analytics across 200,351 properties in 25 Dublin districts and 146 neighbourhoods.
Growth rates are annualised using compound annual growth calculations from each area’s full transaction history. We flag growth data as “reliable” only when there’s a sufficient volume of transactions to support statistical significance.
Prices shown are median values — not averages — which are more representative because they’re not skewed by outliers (a single €5M sale doesn’t distort the picture the way it would with a mean).
This article is updated regularly as new Property Price Register data becomes available. Last updated: March 2026.
Explore the full data: Dublin Districts → | Compare Areas → | Price Trends →