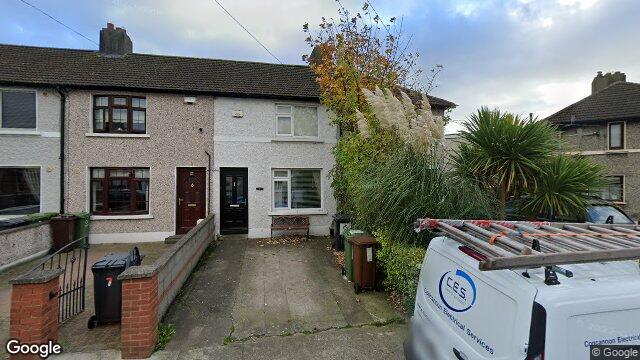
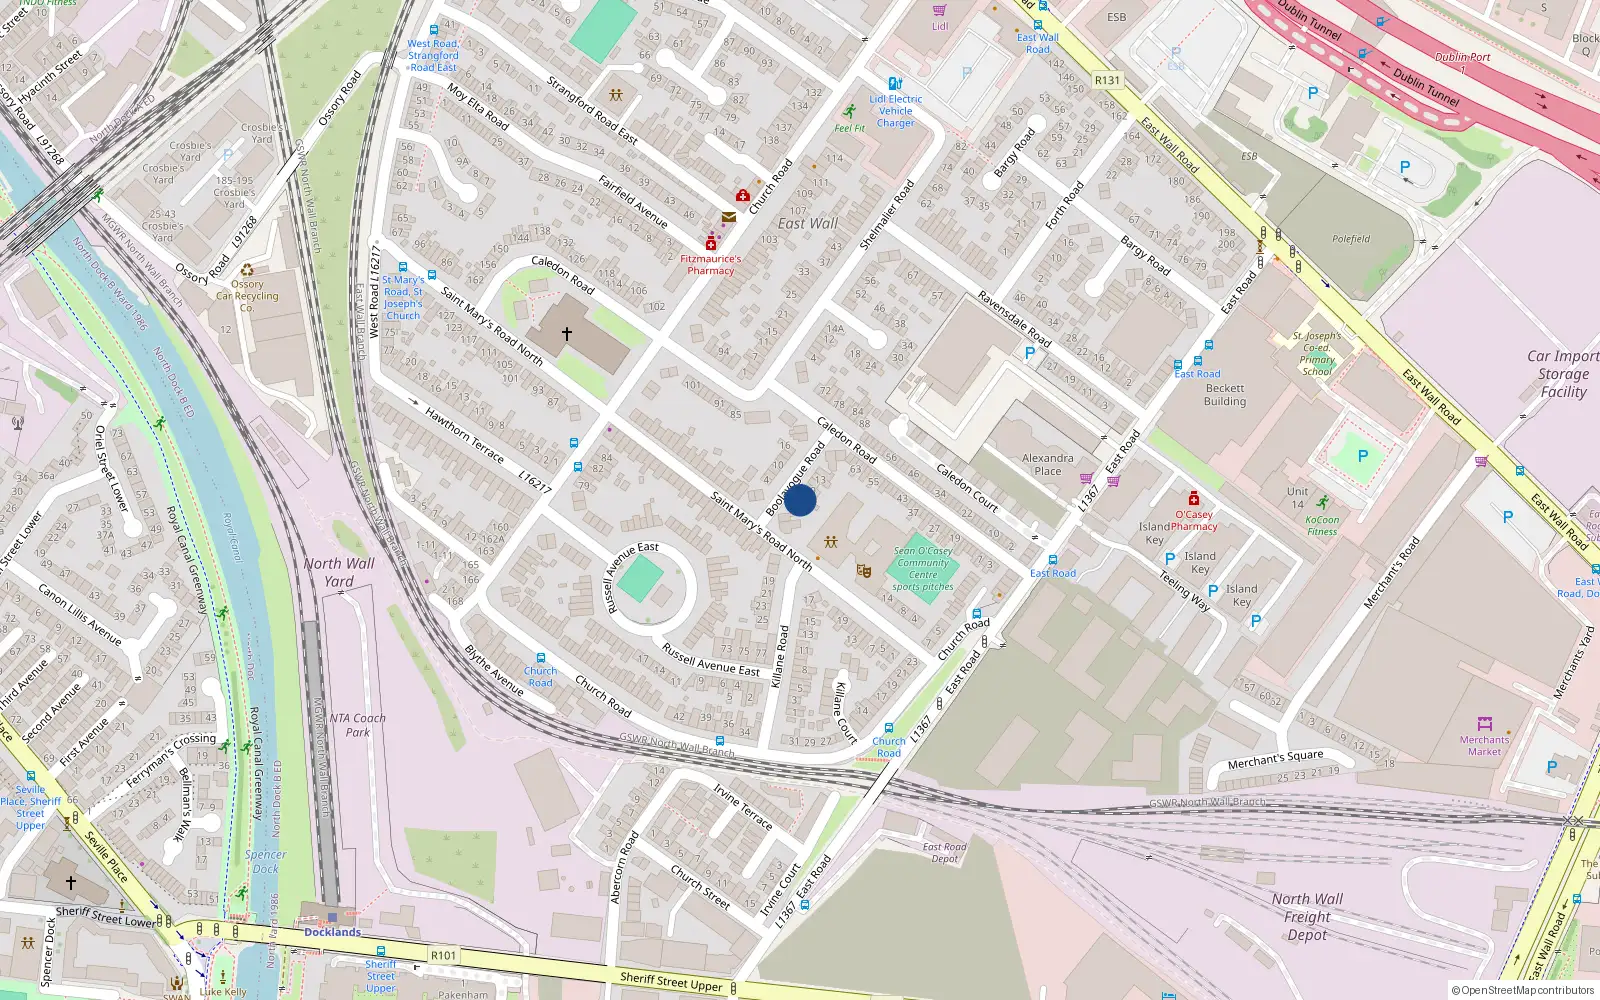
5 Boolavogue Road
Dublin 3 / North Wall / D03HX96
Last Sale Price
Sale History
Overall: +51.3% from €275,000 to €416,000 ( → )
Price History
Price Intelligence
This property has been sold 2 times since 5 Jul 2016. The price has increased by +51.3% from €275,000 to €416,000. That works out to an annualised return of +5.8% over 7.4 years.
Compared to North Wall overall (median €335,000, 668 sales), 5 Boolavogue Road sits 24.2% above the area average.
Repeat-sale properties on Boolavogue Road show a median investment growth rate of +5.8% per year over 9.7 years (2015 to 2025, 3 repeat-sale properties).
What did 5 Boolavogue Road last sell for?
5 Boolavogue Road last sold for €416,000 on 7 Dec 2023.
How many times has 5 Boolavogue Road been sold?
5 Boolavogue Road has been sold 2 times between 5 Jul 2016 and 7 Dec 2023. The price increased by 51.3% over that period.
How does 5 Boolavogue Road compare to the rest of North Wall?
Compared to North Wall (median €335,000, 668 sales), 5 Boolavogue Road sits 24.2% above the area average.
What is the investment growth rate on Boolavogue Road?
Using properties on Boolavogue Road with at least two recorded sales, the median annual growth rate is +5.8% per year over 9.7 years (2015 to 2025, 3 repeat-sale properties). How this is calculated.
Growth metrics use repeat-sale properties only. Methodology.
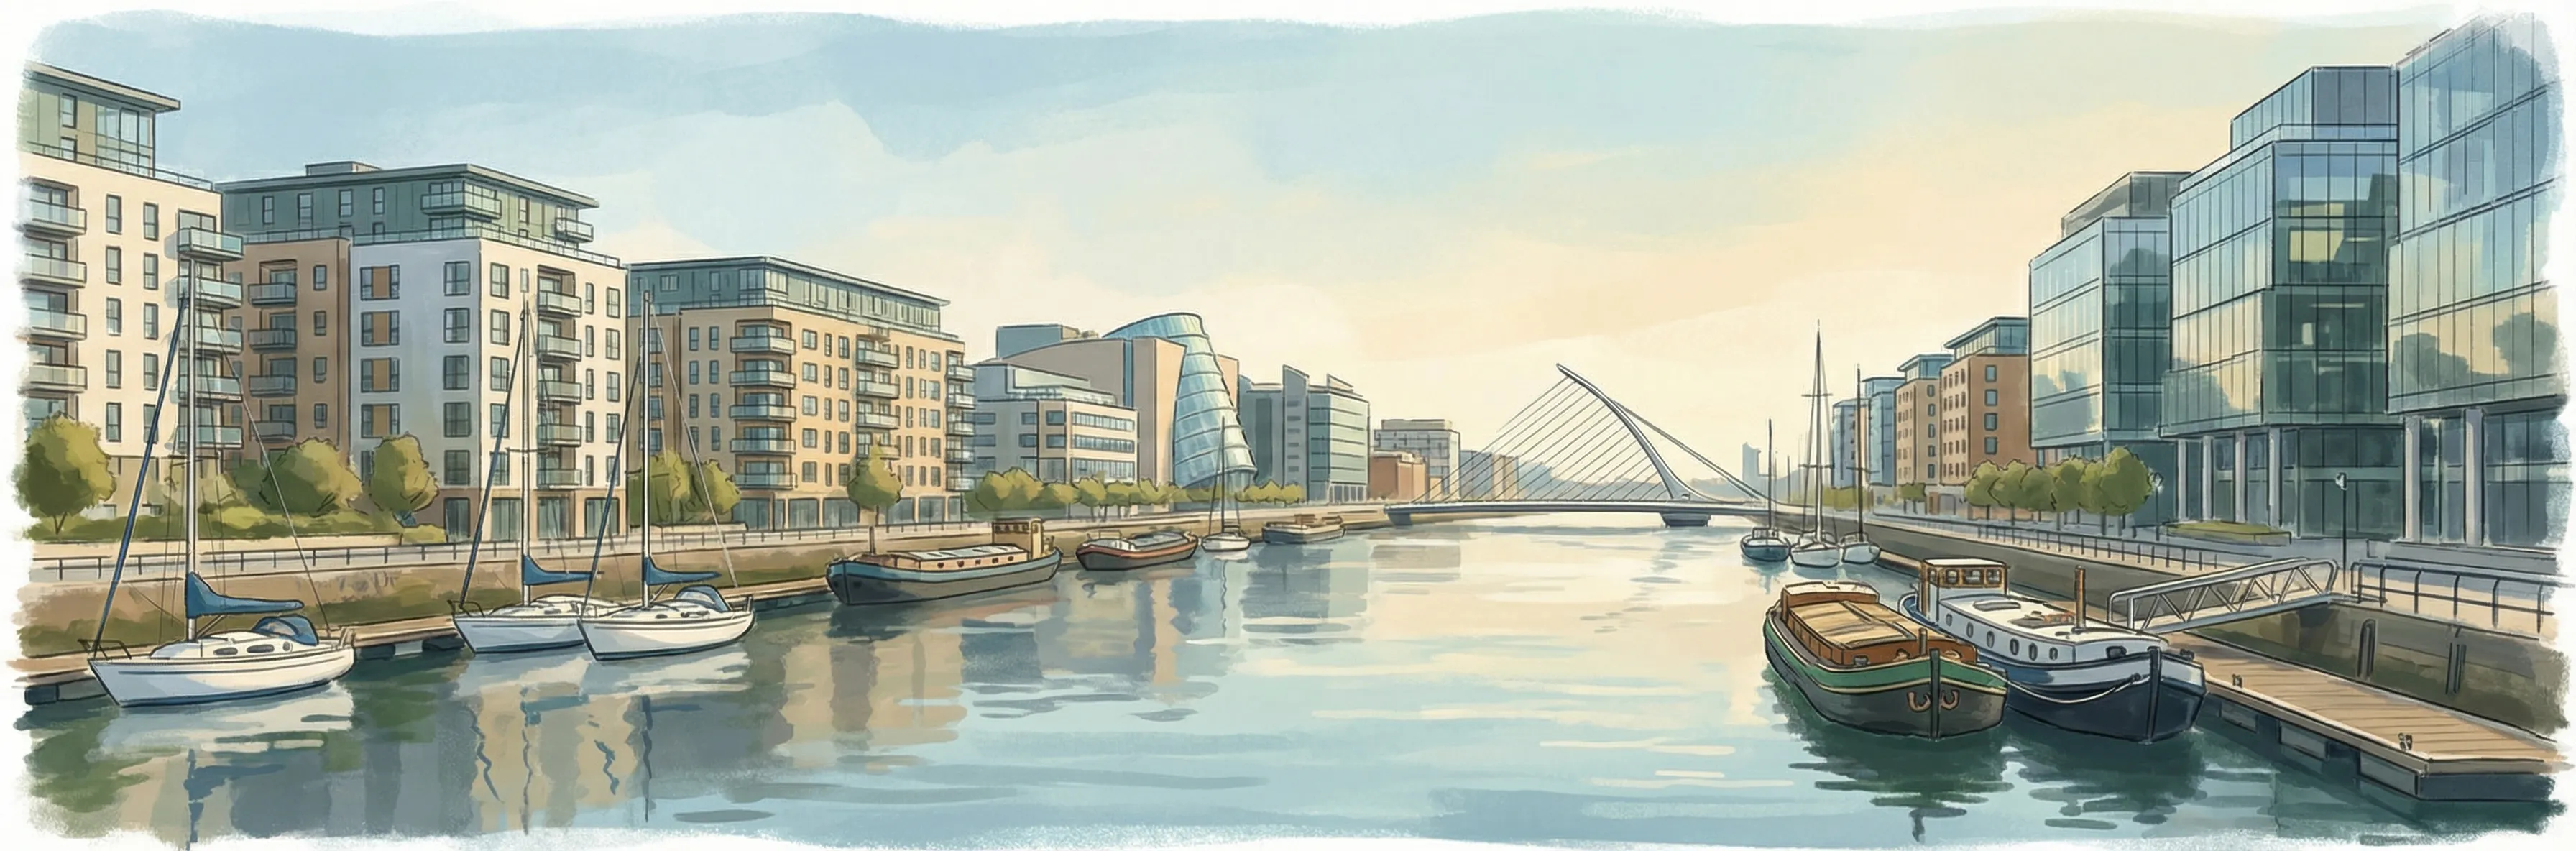
About North Wall
The Dublin 3 portion of the North Wall docklands encompasses East Point Business Park and the commercial developments along the north quays. Modern apartment blocks and offices have replaced the industrial waterfront, though the area retains traces of its port heritage in street names and the occasional warehouse conversion. Well connected by Luas and DART, this stretch of the docklands continues to evolve as Dublin's eastward expansion gathers pace.
Housing in Dublin 3
Based on 11,869 BER assessments — see district details