
The property record
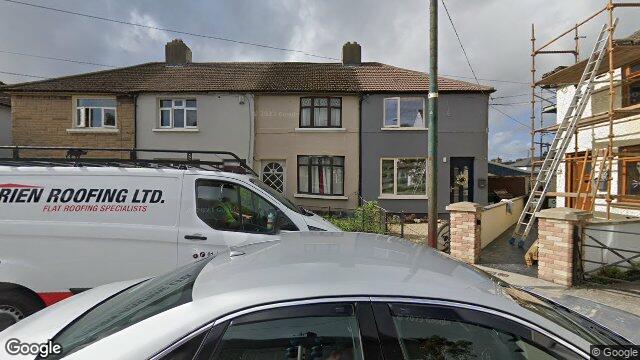
68 Seaview Avenue
Dublin 3 / North Wall / D03DY72
Last Sale Price
Nearby Properties
16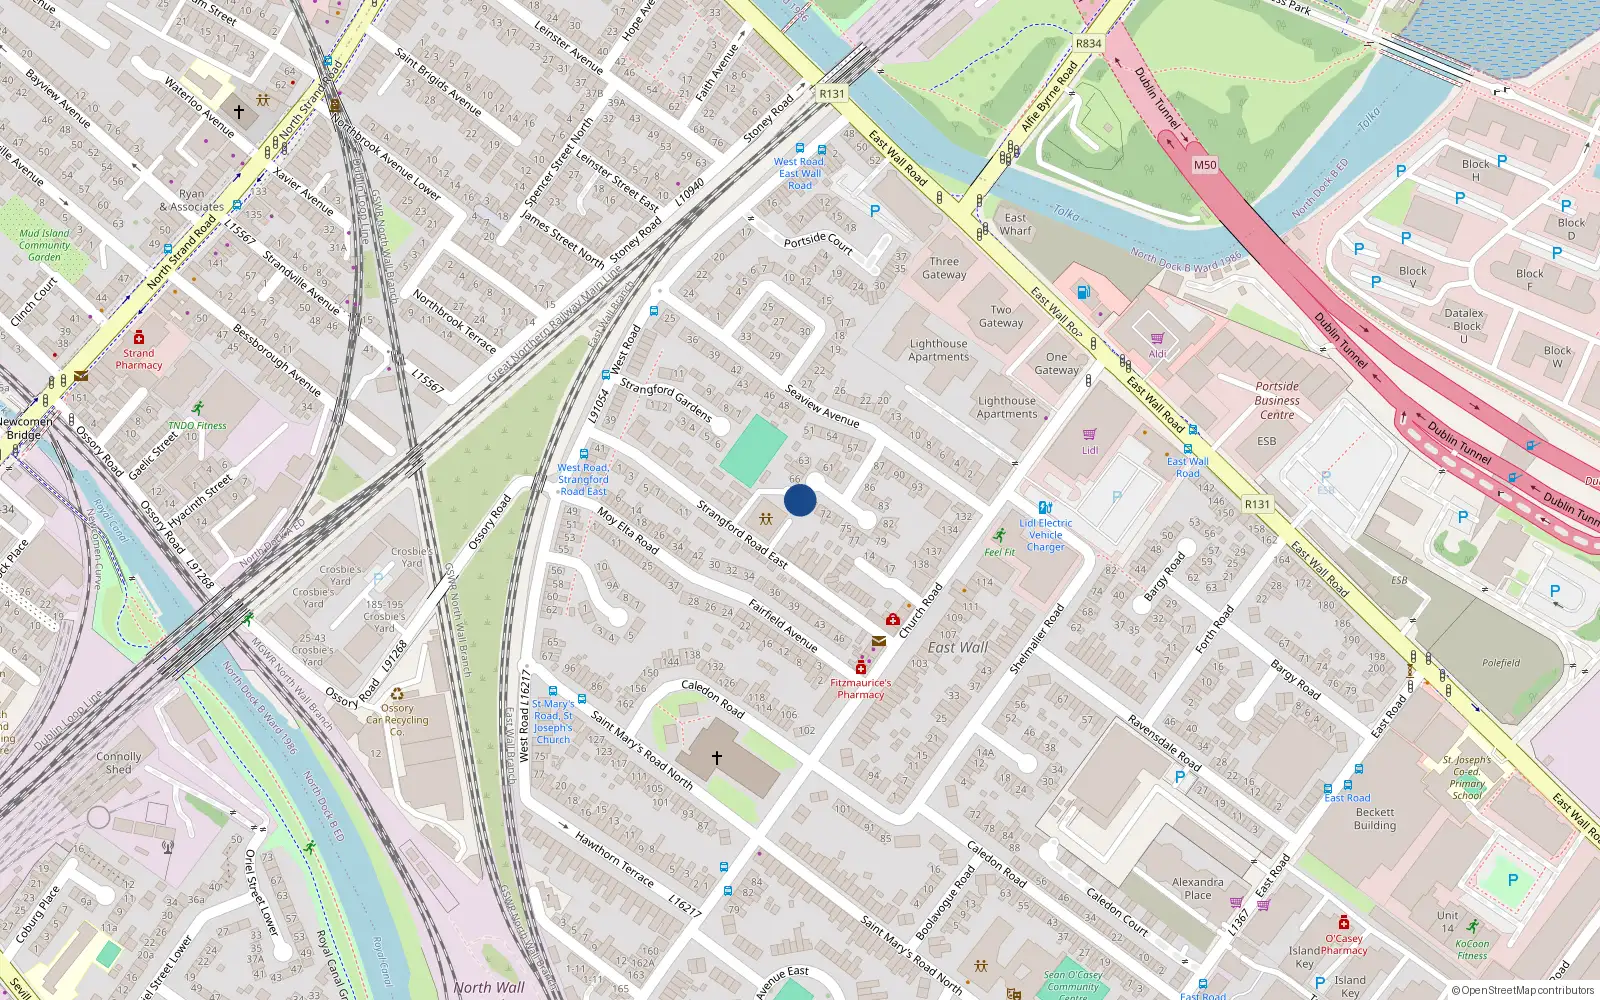
Sale History
Overall: +94.3% from €265,000 to €515,000 ( → )
Price History
Price Intelligence
This property has been sold 3 times since 18 Aug 2023. The price has increased by +94.3% from €265,000 to €515,000. That works out to an annualised return of +37.2% over 2.1 years.
Compared to North Wall overall (median €335,000, 664 sales), 68 Seaview Avenue sits 53.7% above the area average.
Repeat-sale properties on Seaview Avenue East show a median investment growth rate of +19.3% per year over 8.2 years (2017 to 2025, 2 repeat-sale properties).
What did 68 Seaview Avenue last sell for?
68 Seaview Avenue last sold for €515,000 on 30 Sep 2025.
How many times has 68 Seaview Avenue been sold?
68 Seaview Avenue has been sold 3 times between 18 Aug 2023 and 30 Sep 2025. The price increased by 94.3% over that period.
How does 68 Seaview Avenue compare to the rest of North Wall?
Compared to North Wall (median €335,000, 664 sales), 68 Seaview Avenue sits 53.7% above the area average.
What is the investment growth rate on Seaview Avenue East?
Using properties on Seaview Avenue East with at least two recorded sales, the median annual growth rate is +19.3% per year over 8.2 years (2017 to 2025, 2 repeat-sale properties). How this is calculated.
Growth metrics use repeat-sale properties only. Methodology.