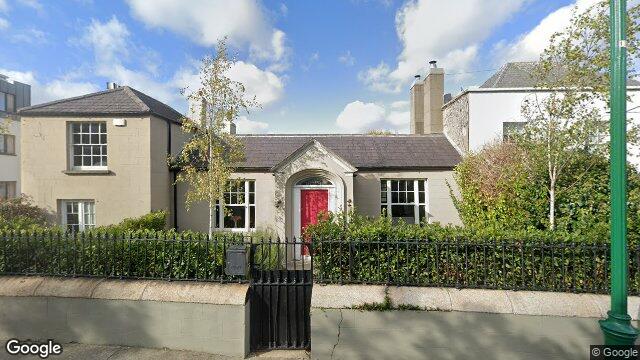
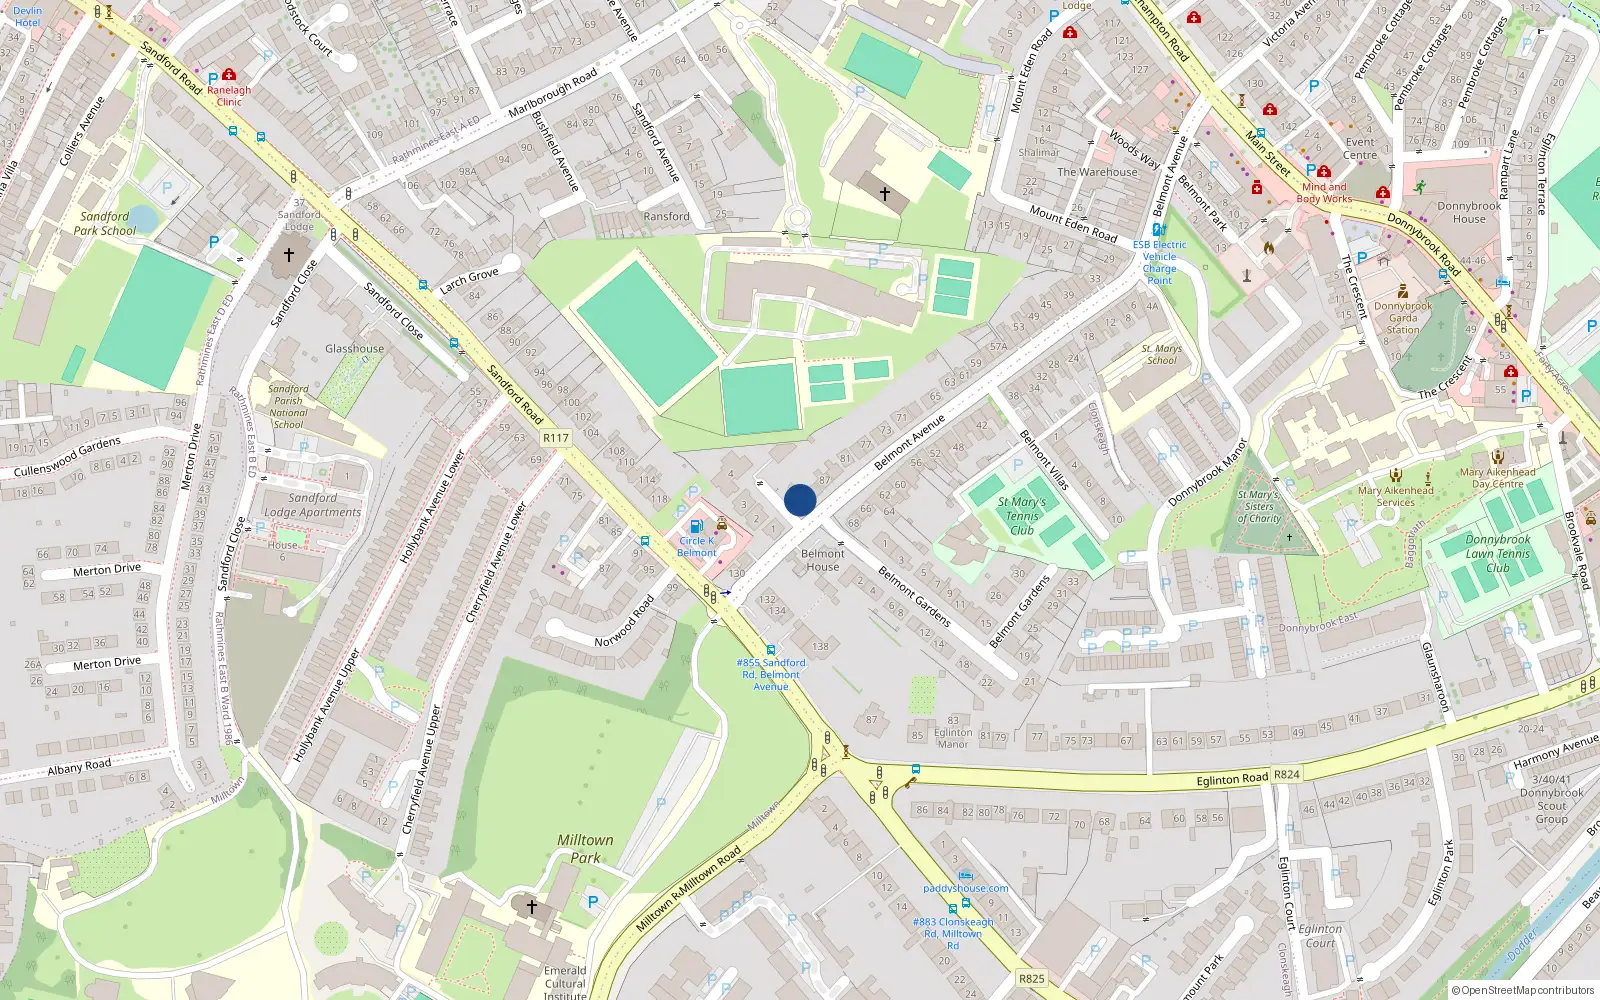
91 Belmont Avenue
Dublin 4 / Donnybrook / D04W2H9
Last Sale Price
Sale History
Overall: -24.7% from €900,000 to €678,000 ( → )
Price History
Price Intelligence
This property has been sold 2 times since 6 Dec 2013. The price has decreased by -24.7% from €900,000 to €678,000. That works out to an annualised return of -4.0% over 6.9 years.
At €678,000, 91 Belmont Avenue last sold 35.0% below the Belmont Avenue street median of €1,043,500 (based on 42 recorded sales). Compared to Donnybrook overall (median €628,374, 1648 sales), 91 Belmont Avenue sits 7.9% above the area average.
Repeat-sale properties on Belmont Avenue show a median investment growth rate of +4.8% per year over 13.9 years (2011 to 2025, 6 repeat-sale properties).
What did 91 Belmont Avenue last sell for?
91 Belmont Avenue last sold for €678,000 on 6 Nov 2020.
How many times has 91 Belmont Avenue been sold?
91 Belmont Avenue has been sold 2 times between 6 Dec 2013 and 6 Nov 2020. The price decreased by 24.7% over that period.
How does 91 Belmont Avenue compare to others near Belmont Avenue?
At €678,000, 91 Belmont Avenue last sold 35.0% below the Belmont Avenue street median of €1,043,500 (based on 42 recorded sales).
How does 91 Belmont Avenue compare to the rest of Donnybrook?
Compared to Donnybrook (median €628,374, 1,648 sales), 91 Belmont Avenue sits 7.9% above the area average.
What is the investment growth rate on Belmont Avenue?
Using properties on Belmont Avenue with at least two recorded sales, the median annual growth rate is +4.8% per year over 13.9 years (2011 to 2025, 6 repeat-sale properties). How this is calculated.
Growth metrics use repeat-sale properties only. Methodology.
Donnybrook Rental Market
Properties in Donnybrook like this one typically rent for the amounts below, based on tenancies registered with the Residential Tenancies Board.
Based on 53 registered tenancies. Source: RTB Rent Register. Yield estimated from median area rent vs last sale price.
About Donnybrook
The village that lent its name to the English language — the Donnybrook Fair ran from 1204 until 1855, growing so notorious for brawling that a 'donnybrook' became a synonym for a rowdy fight. Today the village is considerably more refined: tree-lined residential streets, a rugby ground, the RTE campus at Montrose, and a parish church dating to the eighth century. The proximity to Herbert Park and UCD keeps the area feeling connected without being crowded.
Housing in Dublin 4
Based on 14,024 BER assessments — see district details