Ballybrack
Dún Laoghaire–Rathdown / Ballybrack / A96YE16
Last Sale Price
Sale History
Overall: +99.0% from €800,000 to €1,592,000 ( → )
Price History
Price Intelligence
This property has been sold 2 times since 25 Feb 2013. The price has increased by +99.0% from €800,000 to €1,592,000. That works out to an annualised return of +6.1% over 11.7 years.
At €1,592,000, Ballybrack last sold 75.9% above the Killiney Avenue street median of €905,000 (based on 13 recorded sales). Compared to Ballybrack overall (median €415,000, 359 sales), Ballybrack sits 283.6% above the area average.
Repeat-sale properties on Killiney Avenue show a median investment growth rate of +7.5% per year over 11.7 years (2013 to 2024, 2 repeat-sale properties).
What did Ballybrack last sell for?
Ballybrack last sold for €1,592,000 on 15 Nov 2024.
How many times has Ballybrack been sold?
Ballybrack has been sold 2 times between 25 Feb 2013 and 15 Nov 2024. The price increased by 99.0% over that period.
How does Ballybrack compare to others near Killiney Avenue?
At €1,592,000, Ballybrack last sold 75.9% above the Killiney Avenue street median of €905,000 (based on 13 recorded sales).
How does Ballybrack compare to the rest of Ballybrack?
Compared to Ballybrack (median €415,000, 359 sales), Ballybrack sits 283.6% above the area average.
What is the investment growth rate on Killiney Avenue?
Using properties on Killiney Avenue with at least two recorded sales, the median annual growth rate is +7.5% per year over 11.7 years (2013 to 2024, 2 repeat-sale properties). How this is calculated.
Growth metrics use repeat-sale properties only. Methodology.
About Ballybrack
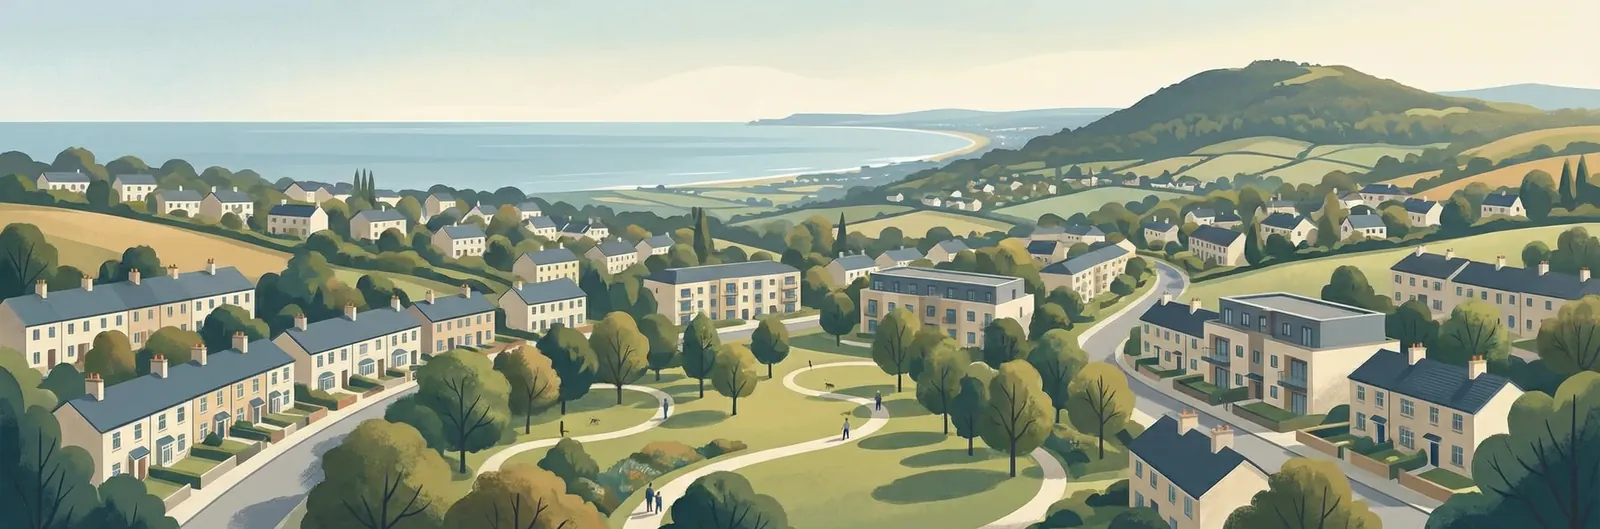
Settled on the hillside between Killiney and Shankill, Ballybrack is a residential suburb that grew steadily through the twentieth century. The terrain rises from the DART line at the coast toward the higher ground inland, giving many homes elevated views over Dublin Bay. The village centre provides essential services, and the proximity to both Killiney Hill and the coastal walks means open countryside is never far from the doorstep.
Housing in Dún Laoghaire–Rathdown
Based on 29,035 BER assessments — see district details