
The property record
Ballybrack
Dún Laoghaire–Rathdown / Ballybrack / A96A9Y3
Part of Shanganagh Castle Estate
Last Sale Price
€735,000
House
Second-Hand
1 recorded sale
Rent registered · 4 bed
vs Ballybrack
+75.9%
Median €417,751
362 sales
Growth +5.3%/yr · 13.6 yrs
This is more expensive than
81.2%
of properties in Ballybrack.
Percentile of 362 sales
vs Dún Laoghaire–Rathdown
+35.2%
Median €543,625
18,784 sales
Growth +6.0%/yr · 16.7 yrs
This is more expensive than
70.1%
of properties in Dún Laoghaire–Rathdown.
Percentile of 18,784 sales
Nearby Properties
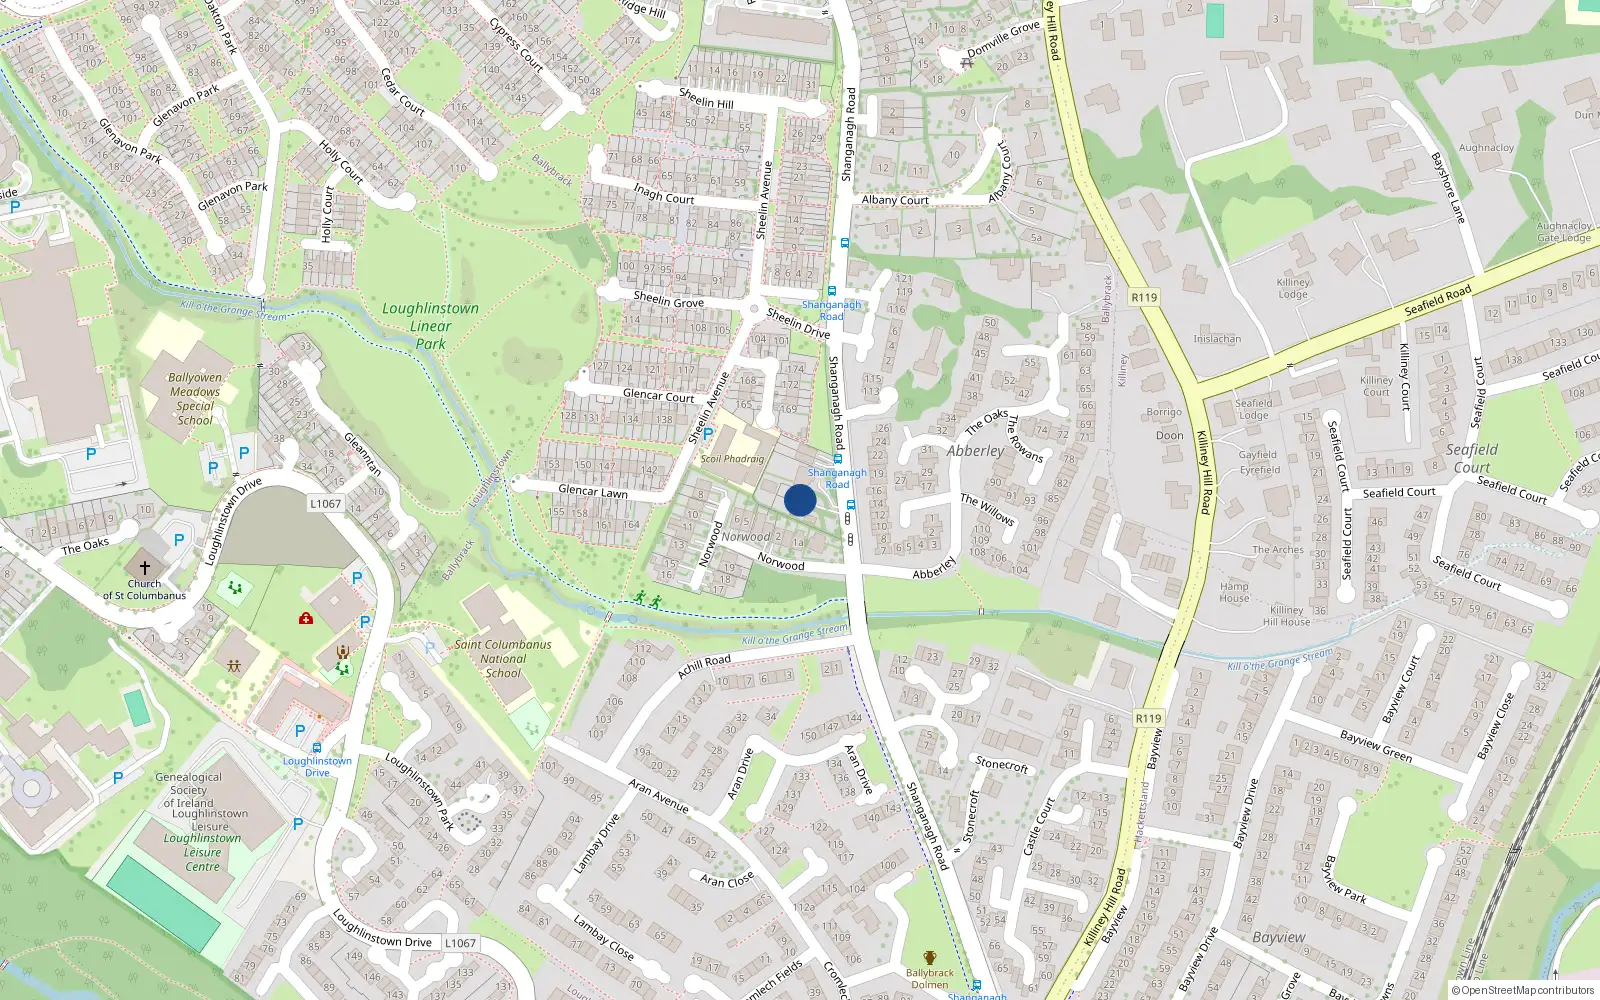
Loading interactive map…
Sale History
€735,000
4 years ago
Second-Hand Dwelling house /Apartment
Price Intelligence
This property has one recorded sale for €735,000 on 19 Aug 2022.
Area Rank
Top 19%
of 362 properties
What did Ballybrack last sell for?
Ballybrack last sold for €735,000 on 19 Aug 2022.
How does Ballybrack compare to the rest of Ballybrack?
Compared to Ballybrack (median €417,751, 362 sales), Ballybrack sits 75.9% above the area average.
Growth metrics use repeat-sale properties only. Methodology.