
Dublin residential property Sale prices · Neighbourhoods · Market trends Records since 2010
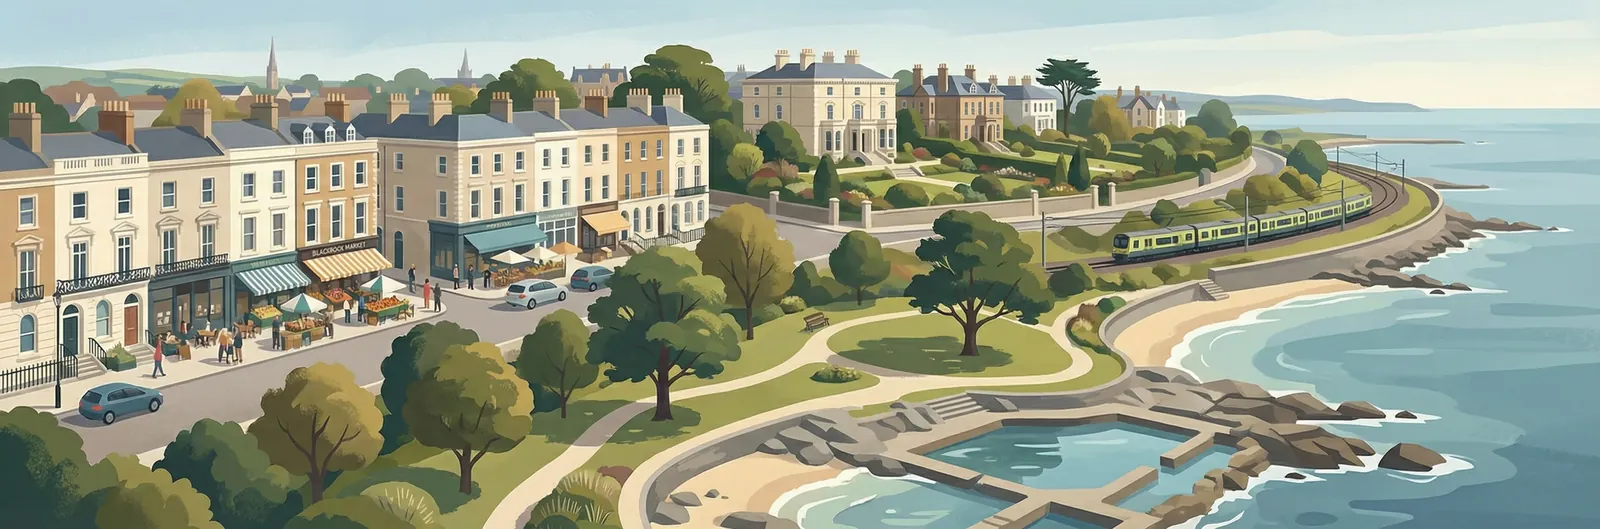
Illustration of the surrounding Blackrock area

The property record

1 Castlebyrne Park

Dún Laoghaire–Rathdown / Blackrock

Last Sale Price
€435,000
Estimate mortgage repayments →
House Second-Hand 1 recorded sale
vs Street
-27.1%
Median €597,000
3 sales
(limited data)
vs Blackrock
-24.0%
Median €572,000
1,141 sales
Growth +5.6%/yr · 16.6 yrs
This is more expensive than 32.3% of properties in Blackrock.
Percentile of 1,141 sales
vs Dún Laoghaire–Rathdown
-20.0%
Median €543,625
18,784 sales
Growth +6.0%/yr · 16.7 yrs
This is more expensive than 34.9% of properties in Dún Laoghaire–Rathdown.
Percentile of 18,784 sales
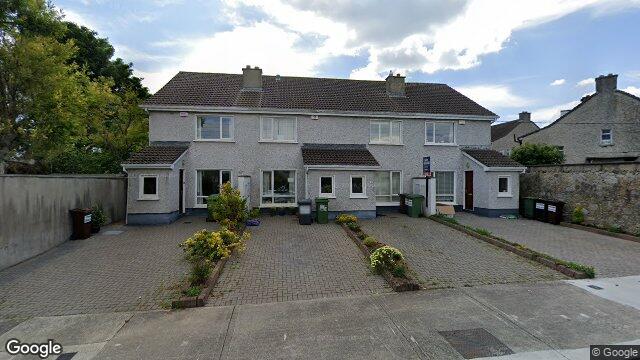
Street view of 1 Castlebyrne Park, Blackrock

Nearby Properties

Overhead map showing the location of 1 Castlebyrne Park, Blackrock
Loading interactive map…

Sale History

1 sale
€435,000
7 years ago
Second-Hand Dwelling house /Apartment

Price Intelligence

This property has one recorded sale for €435,000 on 9 Jan 2019.

What did 1 Castlebyrne Park last sell for?

1 Castlebyrne Park last sold for €435,000 on 9 Jan 2019.

How does 1 Castlebyrne Park compare to the rest of Blackrock?

Compared to Blackrock (median €572,000, 1,141 sales), 1 Castlebyrne Park sits 24.0% below the area average.

Growth metrics use repeat-sale properties only. Methodology.

Blackrock Rental Market

Properties in Blackrock like this one typically rent for the amounts below, based on tenancies registered with the Residential Tenancies Board.

€2,540
Median rent / mo
7.0%
Est. gross yield

Based on 26 registered tenancies. Source: RTB Rent Register. Yield estimated from median area rent vs last sale price.

Related Pages