Dublin residential property Sale prices · Neighbourhoods · Market trends Records since 2010
Illustration of the surrounding Bullock area

The property record

7 Felberg

Dún Laoghaire–Rathdown / Bullock / A96DF7X

Last Sale Price
€460,000
Estimate mortgage repayments →
House Second-Hand 2 recorded sales 3.8 yrs tracked
vs Bullock
-45.2%
Median €840,000
563 sales
Growth +5.9%/yr · 13.7 yrs
This is more expensive than 15.1% of properties in Bullock.
Percentile of 563 sales
vs Dún Laoghaire–Rathdown
-15.1%
Median €541,615
18,655 sales
Growth +6.0%/yr · 16.6 yrs
This is more expensive than 39.1% of properties in Dún Laoghaire–Rathdown.
Percentile of 18,655 sales
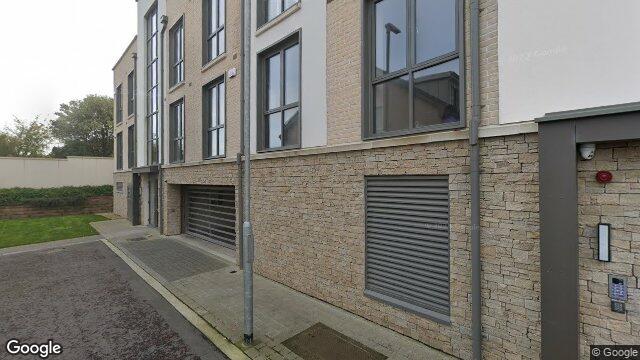
Street view of 7 Felberg, Upper Glenageary Road, Glenageary

Nearby Properties

16
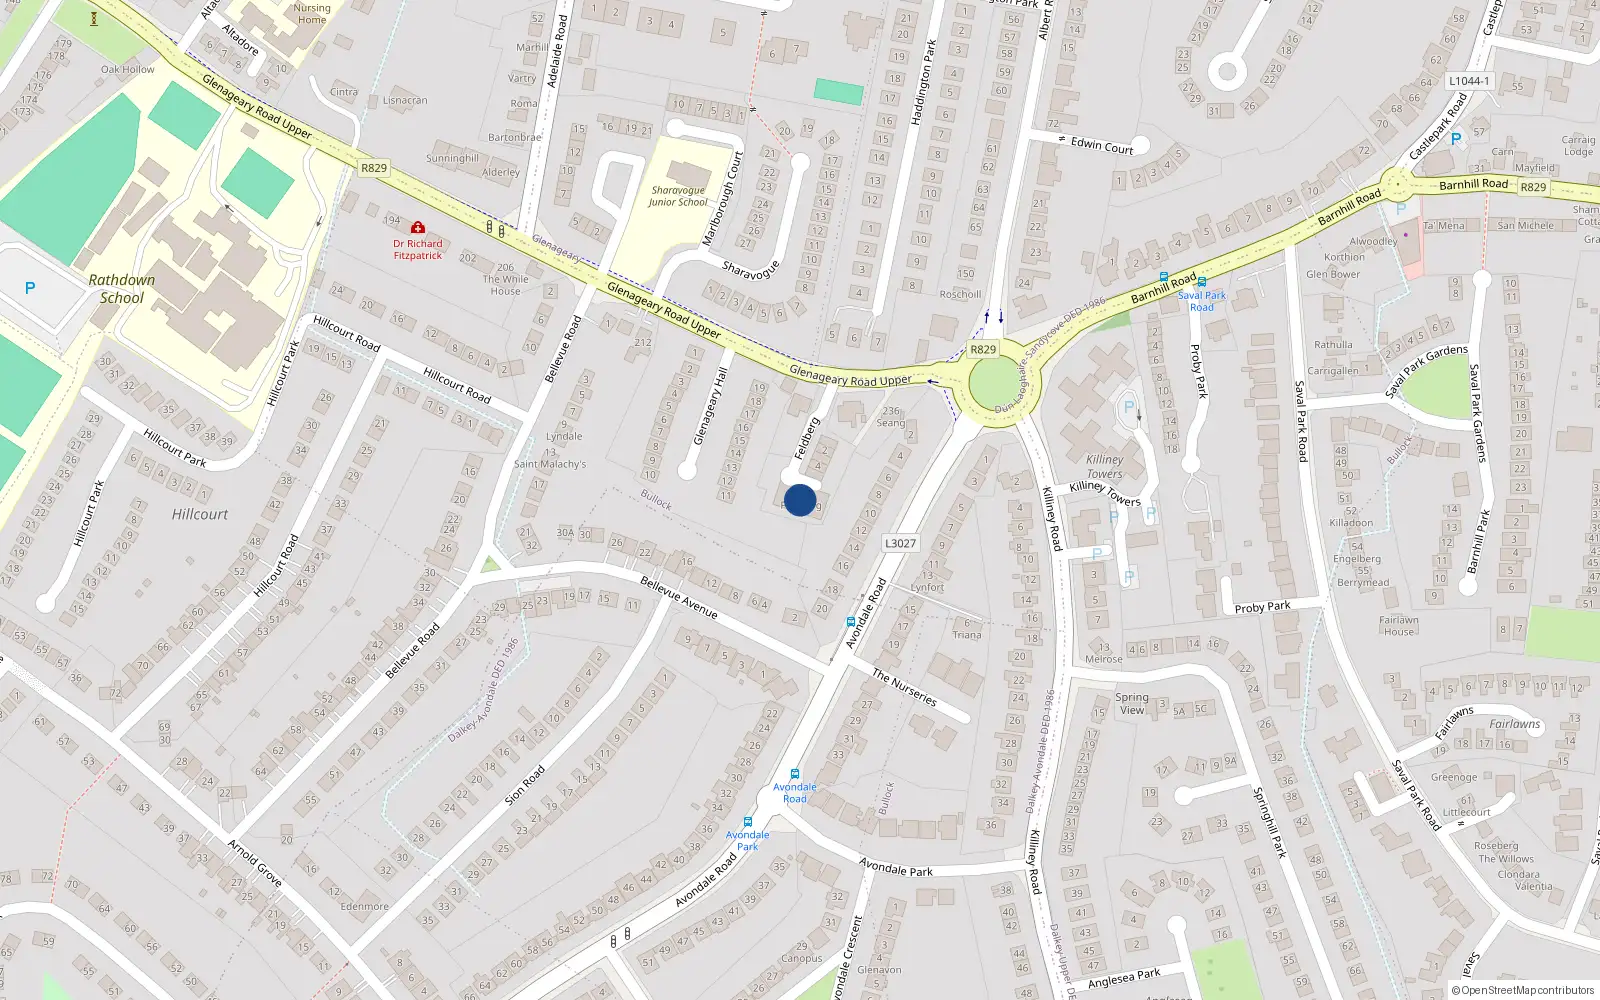
Overhead map showing the location of 7 Felberg, Upper Glenageary Road, Glenageary
Loading interactive map…

Sale History

2 sales
€460,000
2 years ago
Second-Hand Dwelling house /Apartment
+€120,793 (+35.6%) over 3.8 yrs
€339,207
6 years ago
New Dwelling house /Apartment

Overall: +35.6% from €339,207 to €460,000 ( → )


Price History

Loading chart…

Price Intelligence

This property has been sold 2 times since 18 Aug 2020. The price has increased by +35.6% from €339,207 to €460,000. That works out to an annualised return of +8.3% over 3.8 years.

Compared to Bullock overall (median €840,000, 563 sales), 7 Felberg sits 45.2% below the area average.

What did 7 Felberg last sell for?

7 Felberg last sold for €460,000 on 13 Jun 2024.

How many times has 7 Felberg been sold?

7 Felberg has been sold 2 times between 18 Aug 2020 and 13 Jun 2024. The price increased by 35.6% over that period.

How does 7 Felberg compare to the rest of Bullock?

Compared to Bullock (median €840,000, 563 sales), 7 Felberg sits 45.2% below the area average.

Growth metrics use repeat-sale properties only. Methodology.

Related Pages