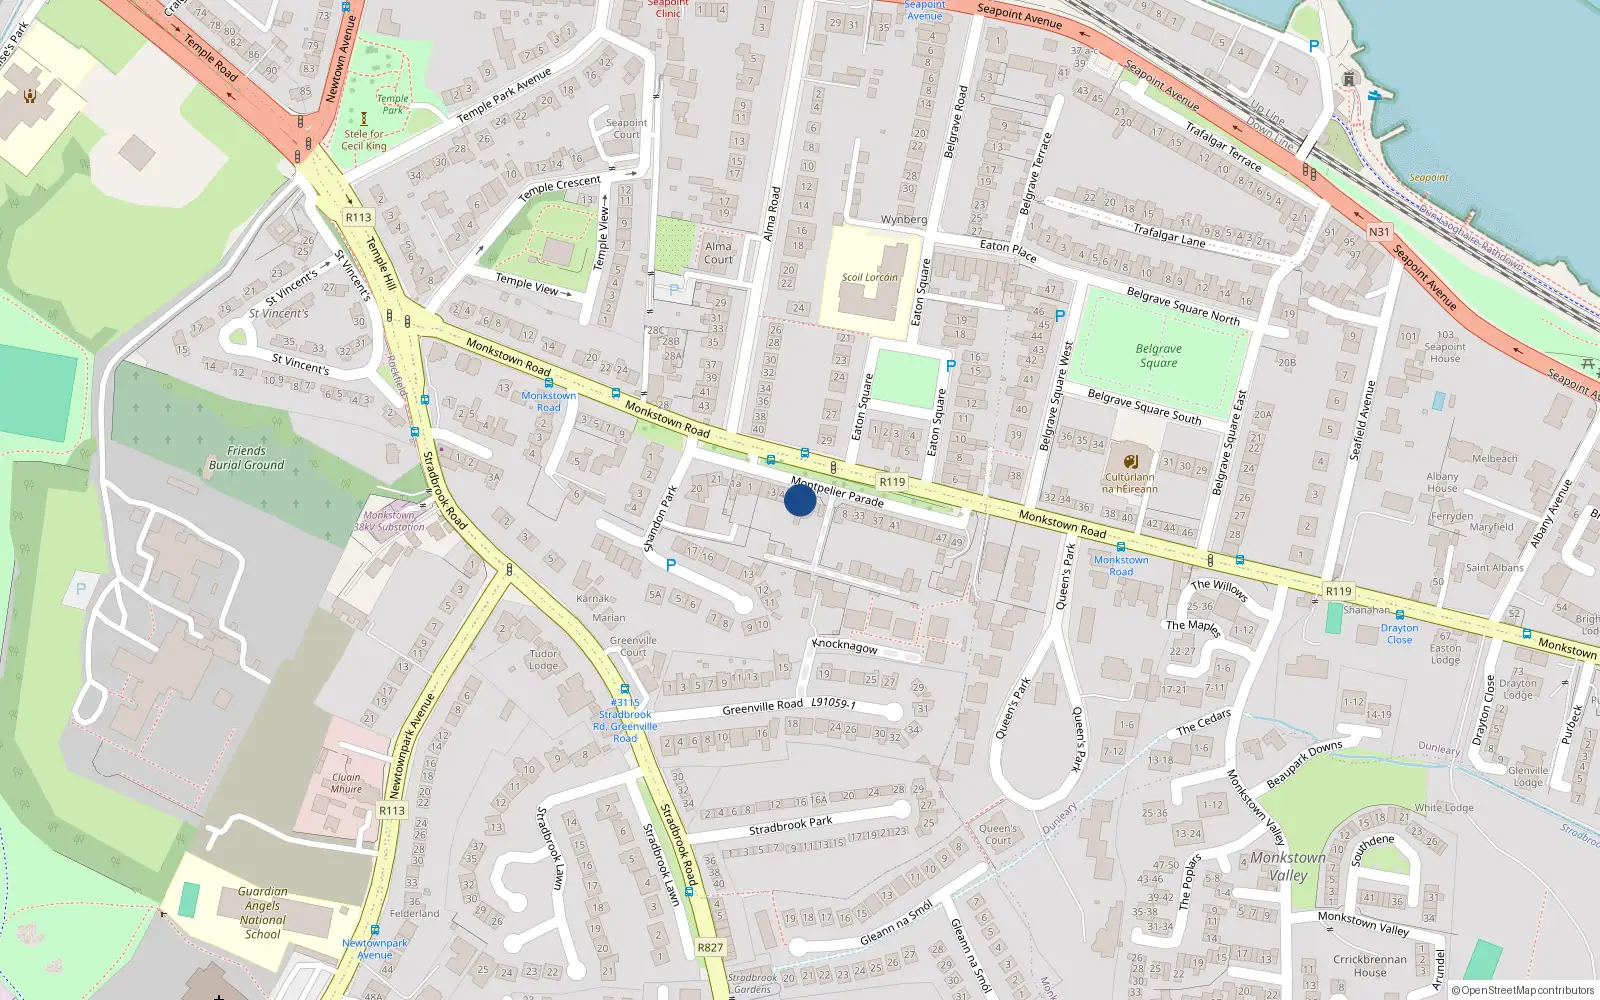
6 Montpelier Parade
Dún Laoghaire–Rathdown / Montpelier / A94PR82
Last Sale Price
Sale History
Overall: +12.5% from €1,200,000 to €1,350,000 ( → )
Price History
Price Intelligence
This property has been sold 2 times since 6 Jun 2017. The price has increased by +12.5% from €1,200,000 to €1,350,000. That works out to an annualised return of +3.2% over 3.7 years.
At €1,350,000, 6 Montpelier Parade last sold 5.3% below the Montpelier Parade street median of €1,425,000 (based on 6 recorded sales). Compared to Montpelier overall (median €685,000, 67 sales), 6 Montpelier Parade sits 97.1% above the area average.
Repeat-sale properties on Montpelier Parade show a median investment growth rate of +5.1% per year over 5.9 years (2017 to 2023, 2 repeat-sale properties).
What did 6 Montpelier Parade last sell for?
6 Montpelier Parade last sold for €1,350,000 on 19 Feb 2021.
How many times has 6 Montpelier Parade been sold?
6 Montpelier Parade has been sold 2 times between 6 Jun 2017 and 19 Feb 2021. The price increased by 12.5% over that period.
How does 6 Montpelier Parade compare to others near Montpelier Parade?
At €1,350,000, 6 Montpelier Parade last sold 5.3% below the Montpelier Parade street median of €1,425,000 (based on 6 recorded sales).
How does 6 Montpelier Parade compare to the rest of Montpelier?
Compared to Montpelier (median €685,000, 67 sales), 6 Montpelier Parade sits 97.1% above the area average.
What is the investment growth rate on Montpelier Parade?
Using properties on Montpelier Parade with at least two recorded sales, the median annual growth rate is +5.1% per year over 5.9 years (2017 to 2023, 2 repeat-sale properties). How this is calculated.
Growth metrics use repeat-sale properties only. Methodology.
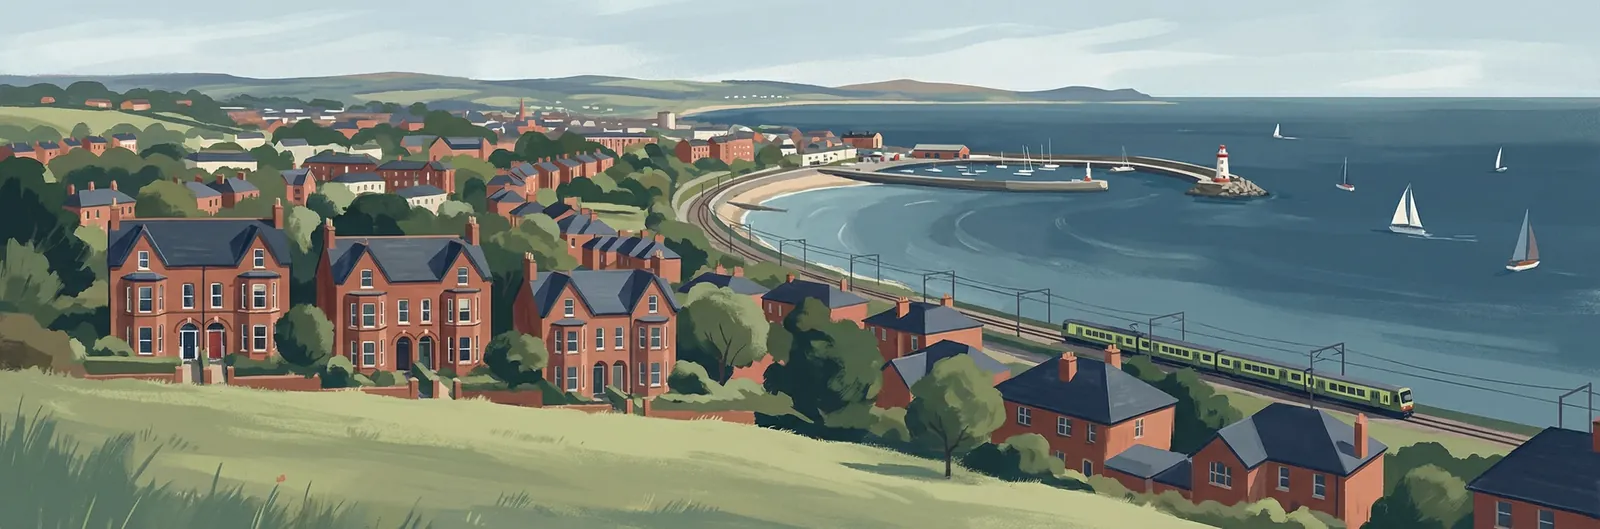
About Montpelier
A townland between Blackrock and Monkstown, Montpelier takes its name from a house and grounds marked on John Roque's 1760 map, set amid what was then open countryside. Montpelier Place — a terrace of handsome Georgian houses dating from about 1790, built as summer retreats from the city — is one of the earliest residential developments in south County Dublin. The area's period character and proximity to both Blackrock and Monkstown villages make it quietly sought-after.
Housing in Dún Laoghaire–Rathdown
Based on 29,035 BER assessments — see district details