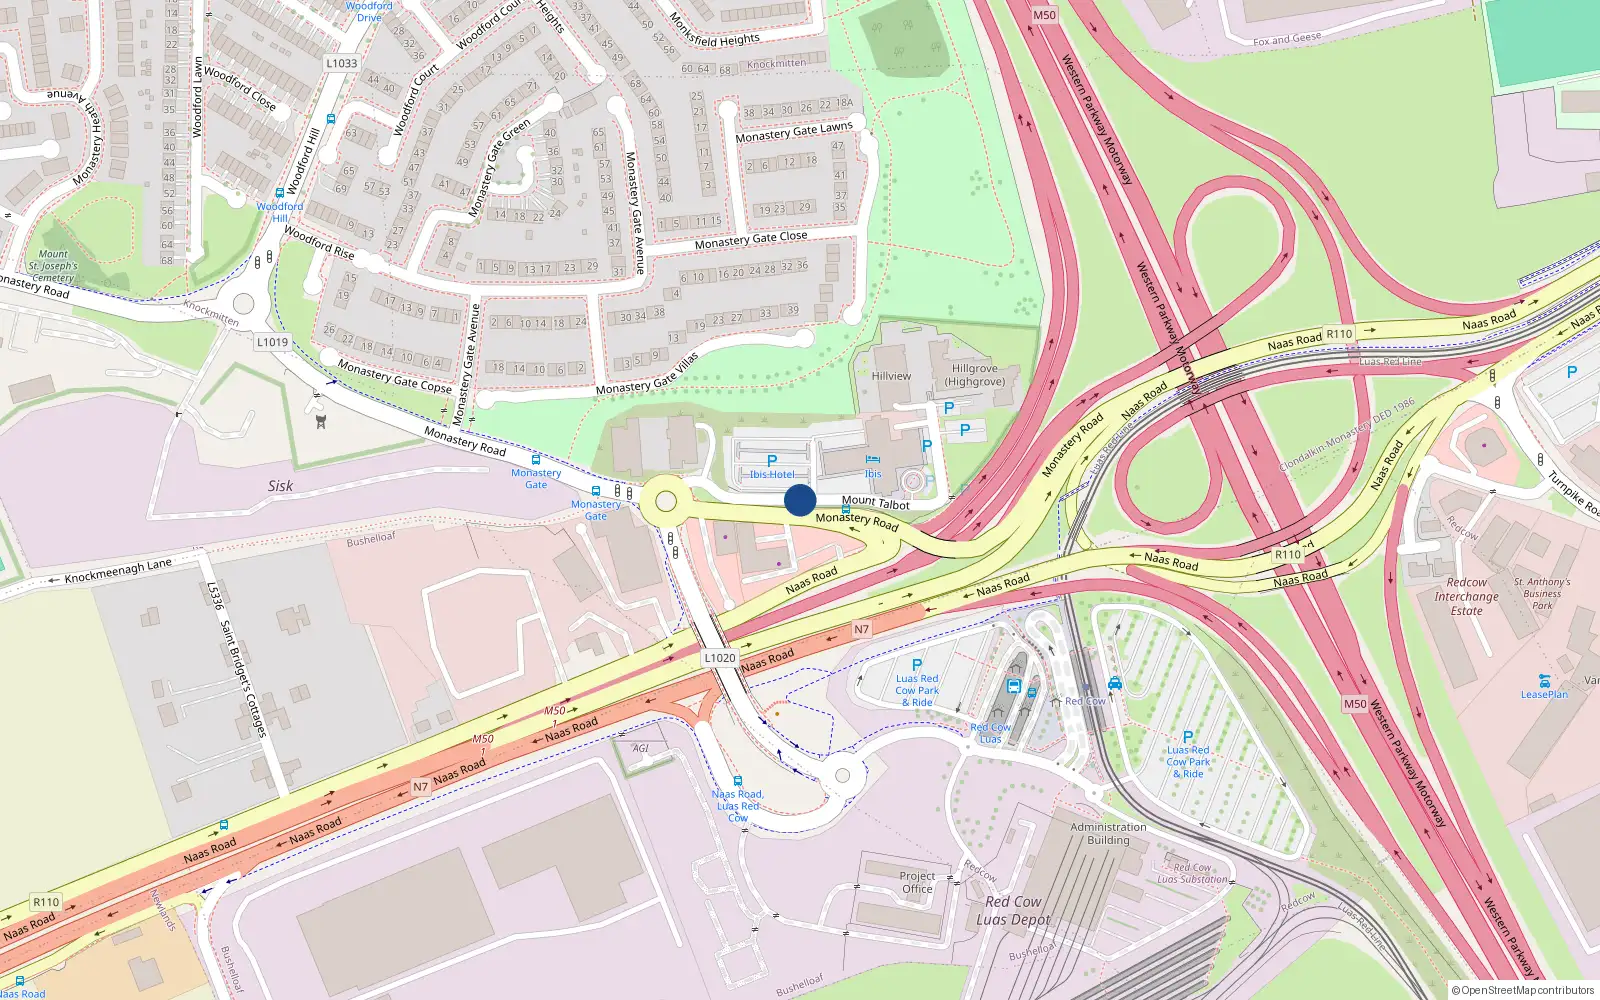
84 Mount Talbot
South Dublin / Clondalkin
Last Sale Price
Sale History
Overall: +27.8% from €180,000 to €230,000 ( → )
Price History
Price Intelligence
This property has been sold 2 times since 4 Dec 2015. The price has increased by +27.8% from €180,000 to €230,000. That works out to an annualised return of +6.3% over 4.0 years.
Compared to Clondalkin overall (median €197,000, 189 sales), 84 Mount Talbot sits 16.8% above the area average.
Repeat-sale properties on Mount Talbot show a median investment growth rate of +7.7% per year over 4.9 years (2014 to 2019, 2 repeat-sale properties).
What did 84 Mount Talbot last sell for?
84 Mount Talbot last sold for €230,000 on 20 Nov 2019.
How many times has 84 Mount Talbot been sold?
84 Mount Talbot has been sold 2 times between 4 Dec 2015 and 20 Nov 2019. The price increased by 27.8% over that period.
How does 84 Mount Talbot compare to the rest of Clondalkin?
Compared to Clondalkin (median €197,000, 189 sales), 84 Mount Talbot sits 16.8% above the area average.
What is the investment growth rate on Mount Talbot?
Using properties on Mount Talbot with at least two recorded sales, the median annual growth rate is +7.7% per year over 4.9 years (2014 to 2019, 2 repeat-sale properties). How this is calculated.
Growth metrics use repeat-sale properties only. Methodology.
Clondalkin Rental Market
Properties in Clondalkin like this one typically rent for the amounts below, based on tenancies registered with the Residential Tenancies Board.
Based on 105 registered tenancies. Source: RTB Rent Register. Yield estimated from median area rent vs last sale price.
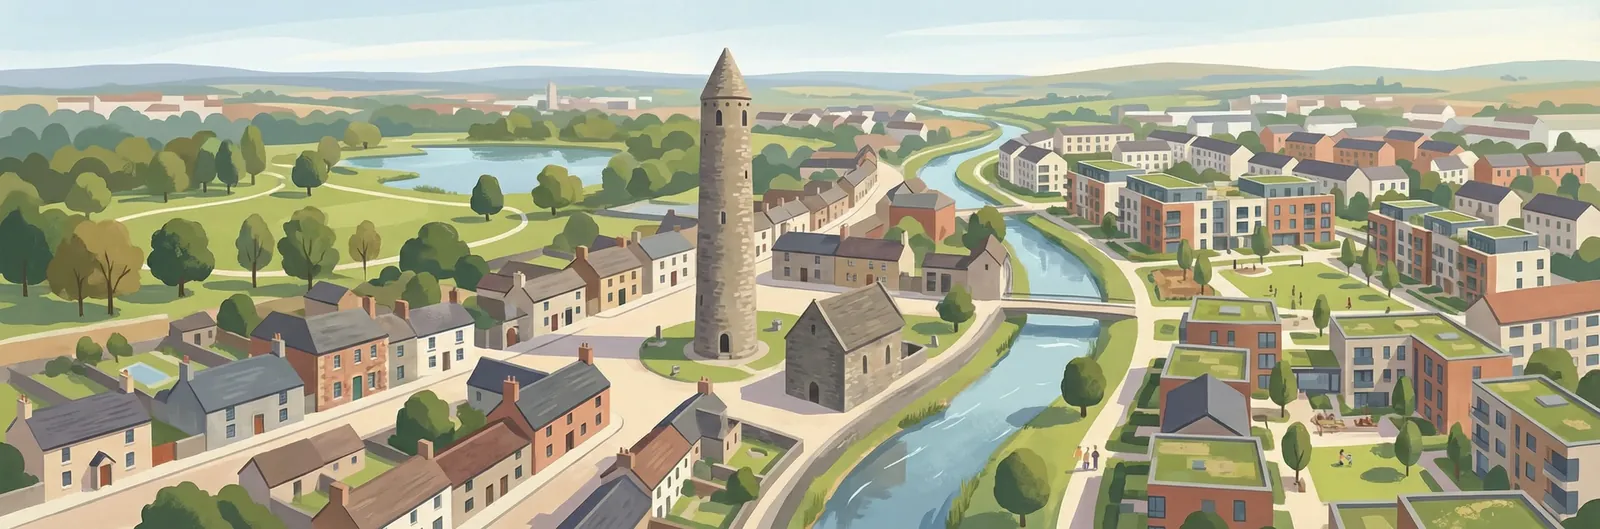
About Clondalkin
The Round Tower — one of the best-preserved in Ireland — stands as a reminder that Clondalkin was a significant monastic settlement from the seventh century onwards. The village retains a discernible centre with shops, pubs, and churches, though the surrounding residential estates have expanded the area's footprint dramatically since the 1960s. The Luas Red Line provides a direct connection to the city, and the Grand Canal Way offers a green corridor through the district.
Housing in South Dublin
Based on 15,045 BER assessments — see district details