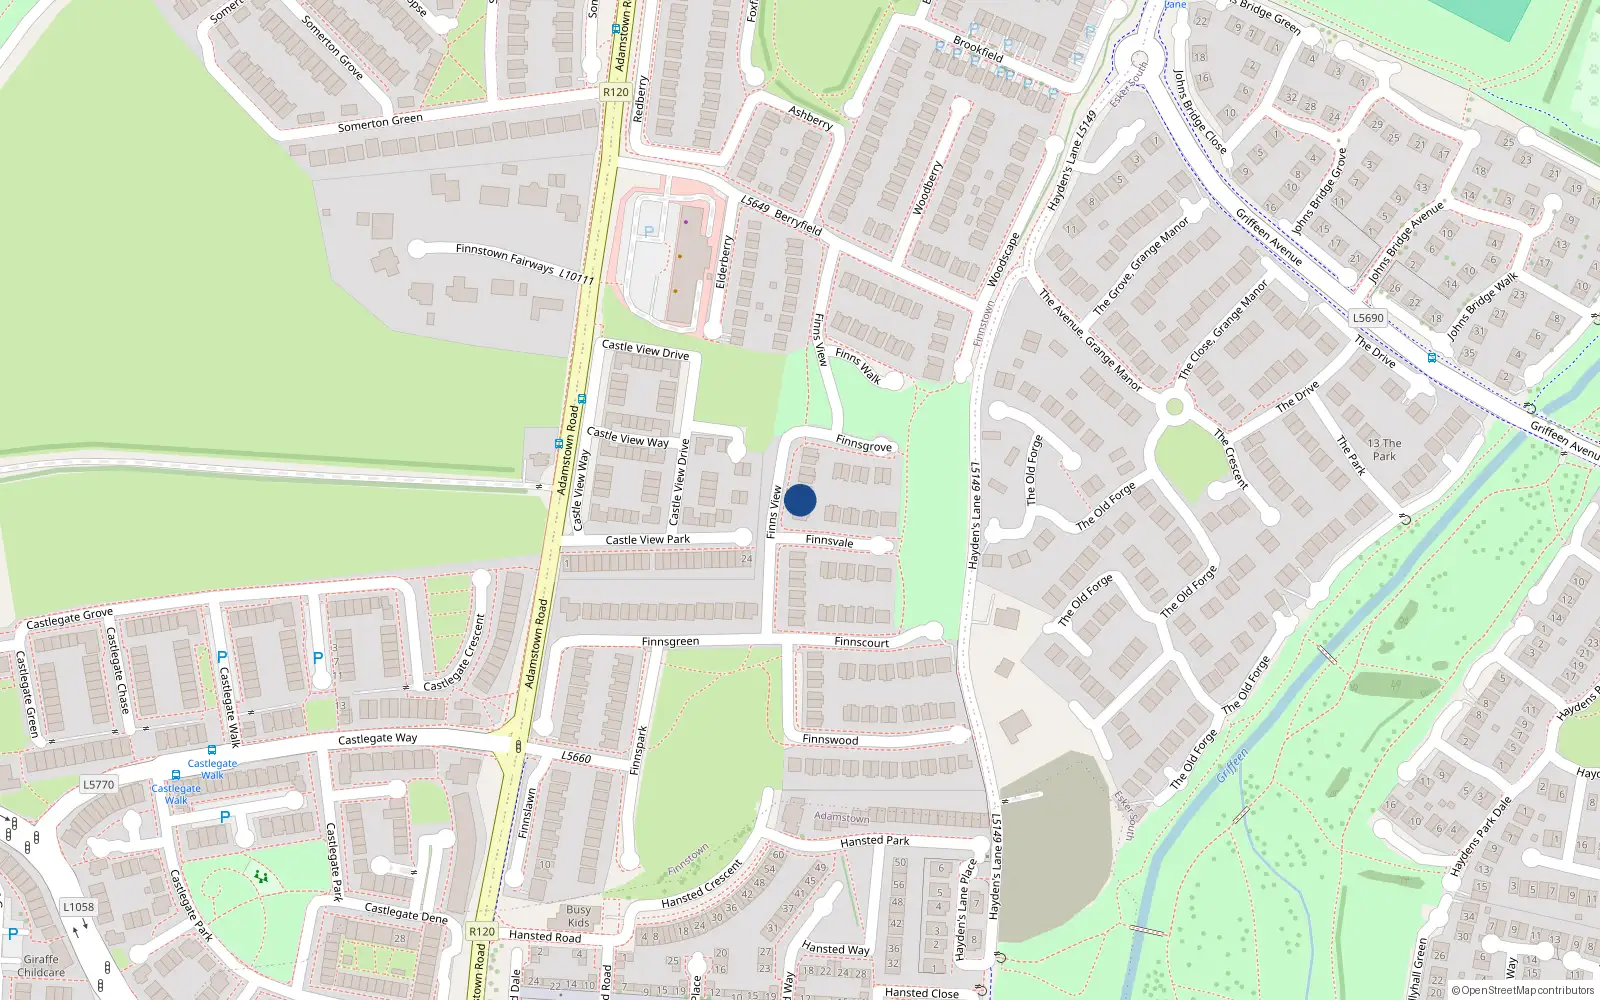
11 Finnsview
South Dublin / Finnstown / K78E094
Last Sale Price

Sale History
Overall: +7.1% from €365,000 to €391,000 ( → )
Price History
Price Intelligence
This property has been sold 2 times since 23 Feb 2018. The price has increased by +7.1% from €365,000 to €391,000. That works out to an annualised return of +1.9% over 3.6 years.
Compared to Finnstown overall (median €317,181, 1499 sales), 11 Finnsview sits 23.3% above the area average.
Repeat-sale properties on Finnsview show a median investment growth rate of +3.8% per year over 7.0 years (2017 to 2024, 2 repeat-sale properties).
What did 11 Finnsview last sell for?
11 Finnsview last sold for €391,000 on 15 Oct 2021.
How many times has 11 Finnsview been sold?
11 Finnsview has been sold 2 times between 23 Feb 2018 and 15 Oct 2021. The price increased by 7.1% over that period.
How does 11 Finnsview compare to the rest of Finnstown?
Compared to Finnstown (median €317,181, 1,499 sales), 11 Finnsview sits 23.3% above the area average.
What is the investment growth rate on Finnsview?
Using properties on Finnsview with at least two recorded sales, the median annual growth rate is +3.8% per year over 7.0 years (2017 to 2024, 2 repeat-sale properties). How this is calculated.
Growth metrics use repeat-sale properties only. Methodology.
About Finnstown
A large residential neighbourhood in the Lucan area, Finnstown grew from the grounds of the former Finnstown House — now a hotel and golf course — into one of west Dublin's most established suburbs. The housing estates that developed from the 1970s onwards are mature and well-maintained, with schools, parks, and a strong sense of community. The proximity to the N4 and Liffey Valley keeps the area well connected to both the city and the western commuter belt.
Housing in South Dublin
Based on 15,045 BER assessments — see district details