
The property record
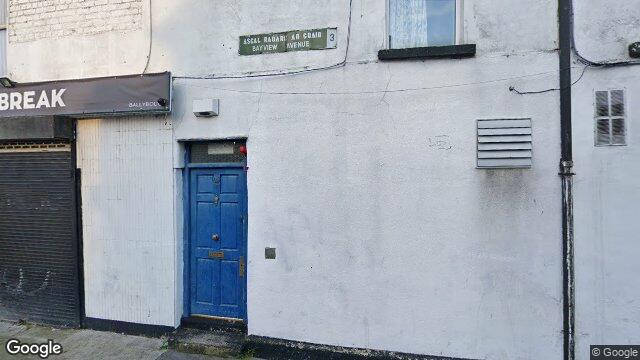
72 Ballybough Road
Dublin 3 / Ballybough / D03YX59
Last Sale Price
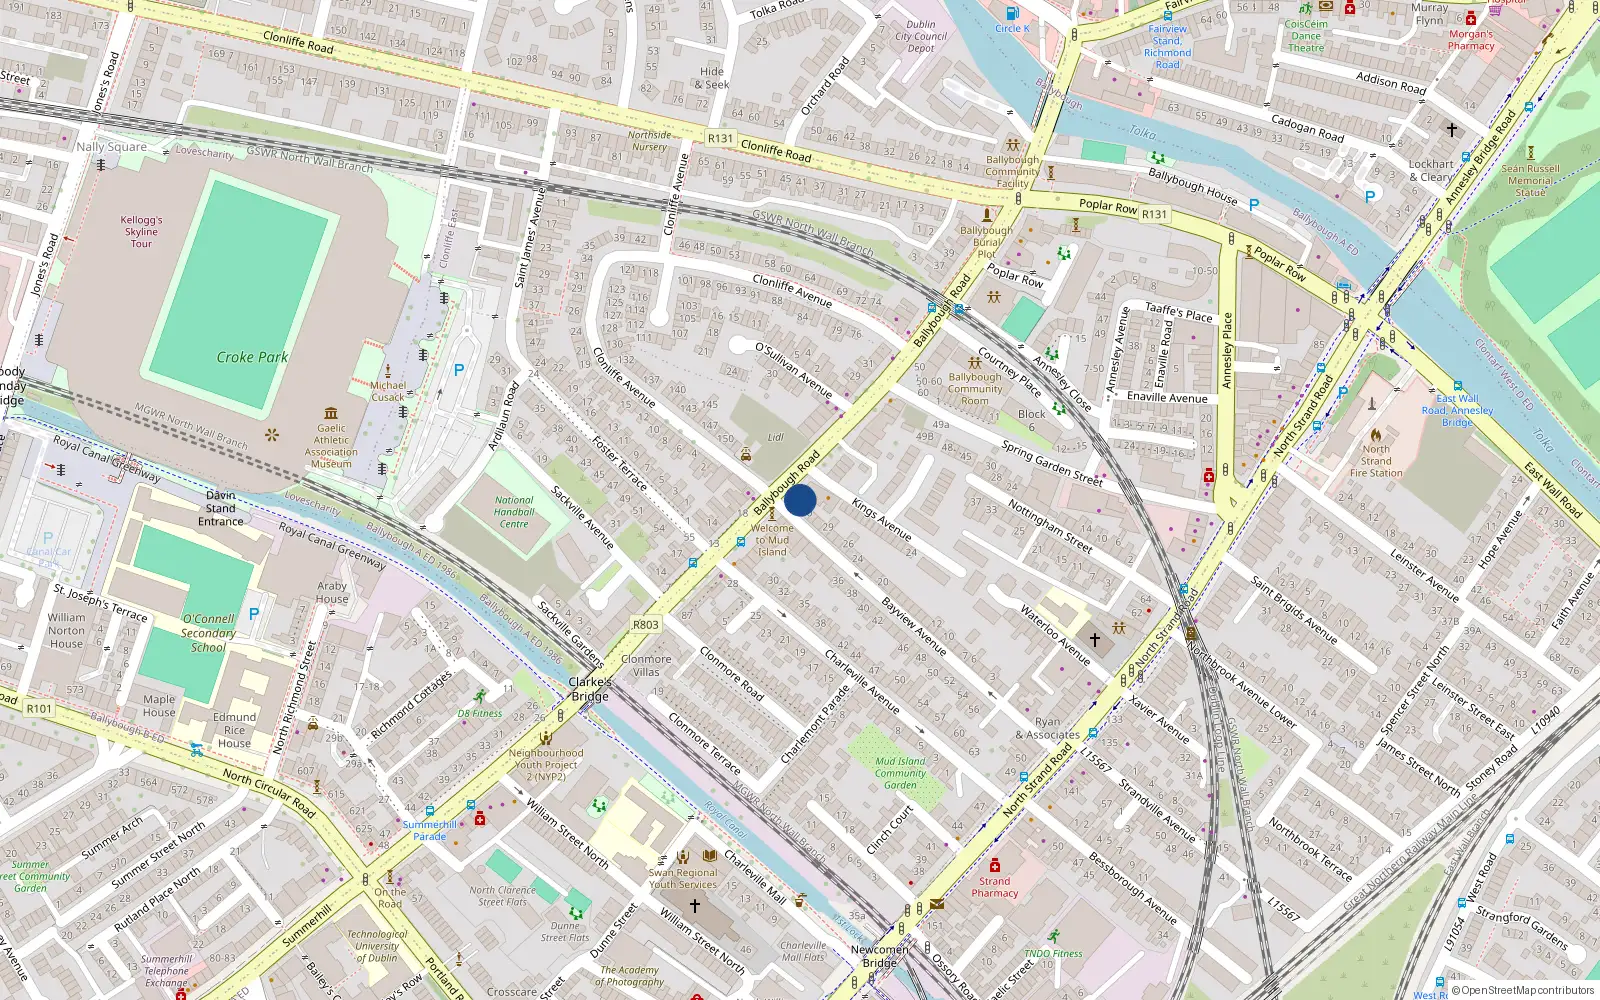
Nearby Properties
Sale History
Overall: +45.8% from €240,000 to €350,000 ( → )
Price History
Price Intelligence
This property has been sold 2 times since 14 Feb 2020. The price has increased by +45.8% from €240,000 to €350,000. That works out to an annualised return of +7.4% over 5.3 years.
At €350,000, 72 Ballybough Road last sold 54.9% above the Ballybough Road street median of €226,000 (based on 13 recorded sales). Compared to Ballybough overall (median €290,000, 107 sales), 72 Ballybough Road sits 20.7% above the area average.
Repeat-sale properties on Ballybough Road show a median investment growth rate of +8.2% per year over 10.7 years (2016 to 2026, 2 repeat-sale properties).
What did 72 Ballybough Road last sell for?
72 Ballybough Road last sold for €350,000 on 23 May 2025.
How many times has 72 Ballybough Road been sold?
72 Ballybough Road has been sold 2 times between 14 Feb 2020 and 23 May 2025. The price increased by 45.8% over that period.
How does 72 Ballybough Road compare to others near Ballybough Road?
At €350,000, 72 Ballybough Road last sold 54.9% above the Ballybough Road street median of €226,000 (based on 13 recorded sales).
How does 72 Ballybough Road compare to the rest of Ballybough?
Compared to Ballybough (median €290,000, 107 sales), 72 Ballybough Road sits 20.7% above the area average.
What is the investment growth rate on Ballybough Road?
Using properties on Ballybough Road with at least two recorded sales, the median annual growth rate is +8.2% per year over 10.7 years (2016 to 2026, 2 repeat-sale properties). How this is calculated.
Growth metrics use repeat-sale properties only. Methodology.